Slides 📊
9.7. Confidence Bounds for the Population Mean When σ is Known
Confidence intervals provide two boundaries that define a plausible range for the true parameter. When the practical interest lies primarily in one direction, however, one-sided confidence bounds offer a more context-appropriate and precise approach. Their logic and derivation follow the same principles as those of two-sided intervals, but they differ in how the probability of error is allocated.
Road Map 🧭
Recognize the situations in which using a one-sided confidence bound may be more precise and cost-efficient than a confidence interval.
Derive a confidence bound using principles parallel to those used in constructing confidence intervals, and apply the result to practice.
9.7.1. Why One‑Sided Bounds?
Two-sided confidence intervals aim to capture the unknown population mean \(\mu\) on both sides of the point estimator \(\bar{X}\). However, many scientific questions call for a directional guarantee. For example:
In certain safety assessments, the mean toxin level must not exceed a legal limit.
The average tensile strength must be at least a promised specification to pass a quality control test.
A component’s mean time to failure must be greater than a minimum benchmark.
A drug’s efficacy must be above a specified threshold.
In these situations, a one-sided confidence bound is not only more directly aligned with the research question but also provides a more precise bound than the interval at the same confidence level.
9.7.2. Deriving the Upper Confidence Bound
The Goal
For an upper confidence bound, we are only concerned with the guarantee that the population mean \(\mu\) is below a certain threshold. That is, for a pre-specified confidence coefficient \(C\) between 0 and 1, we would like to find an upper bound of the form \(\bar{X} + ME\) such that
Preliminaries
The language used in deriving confidence bounds overlaps significantly with that of confidence intervals.
The probability \(C\) is called the confidence coefficient and its conversion to percentage is called the confidence level.
\(\alpha = 1 - C\).
A \(z\)-critical value \(z_\alpha\) marks the location on the standard normal pdf whose upper area is \(\alpha\).
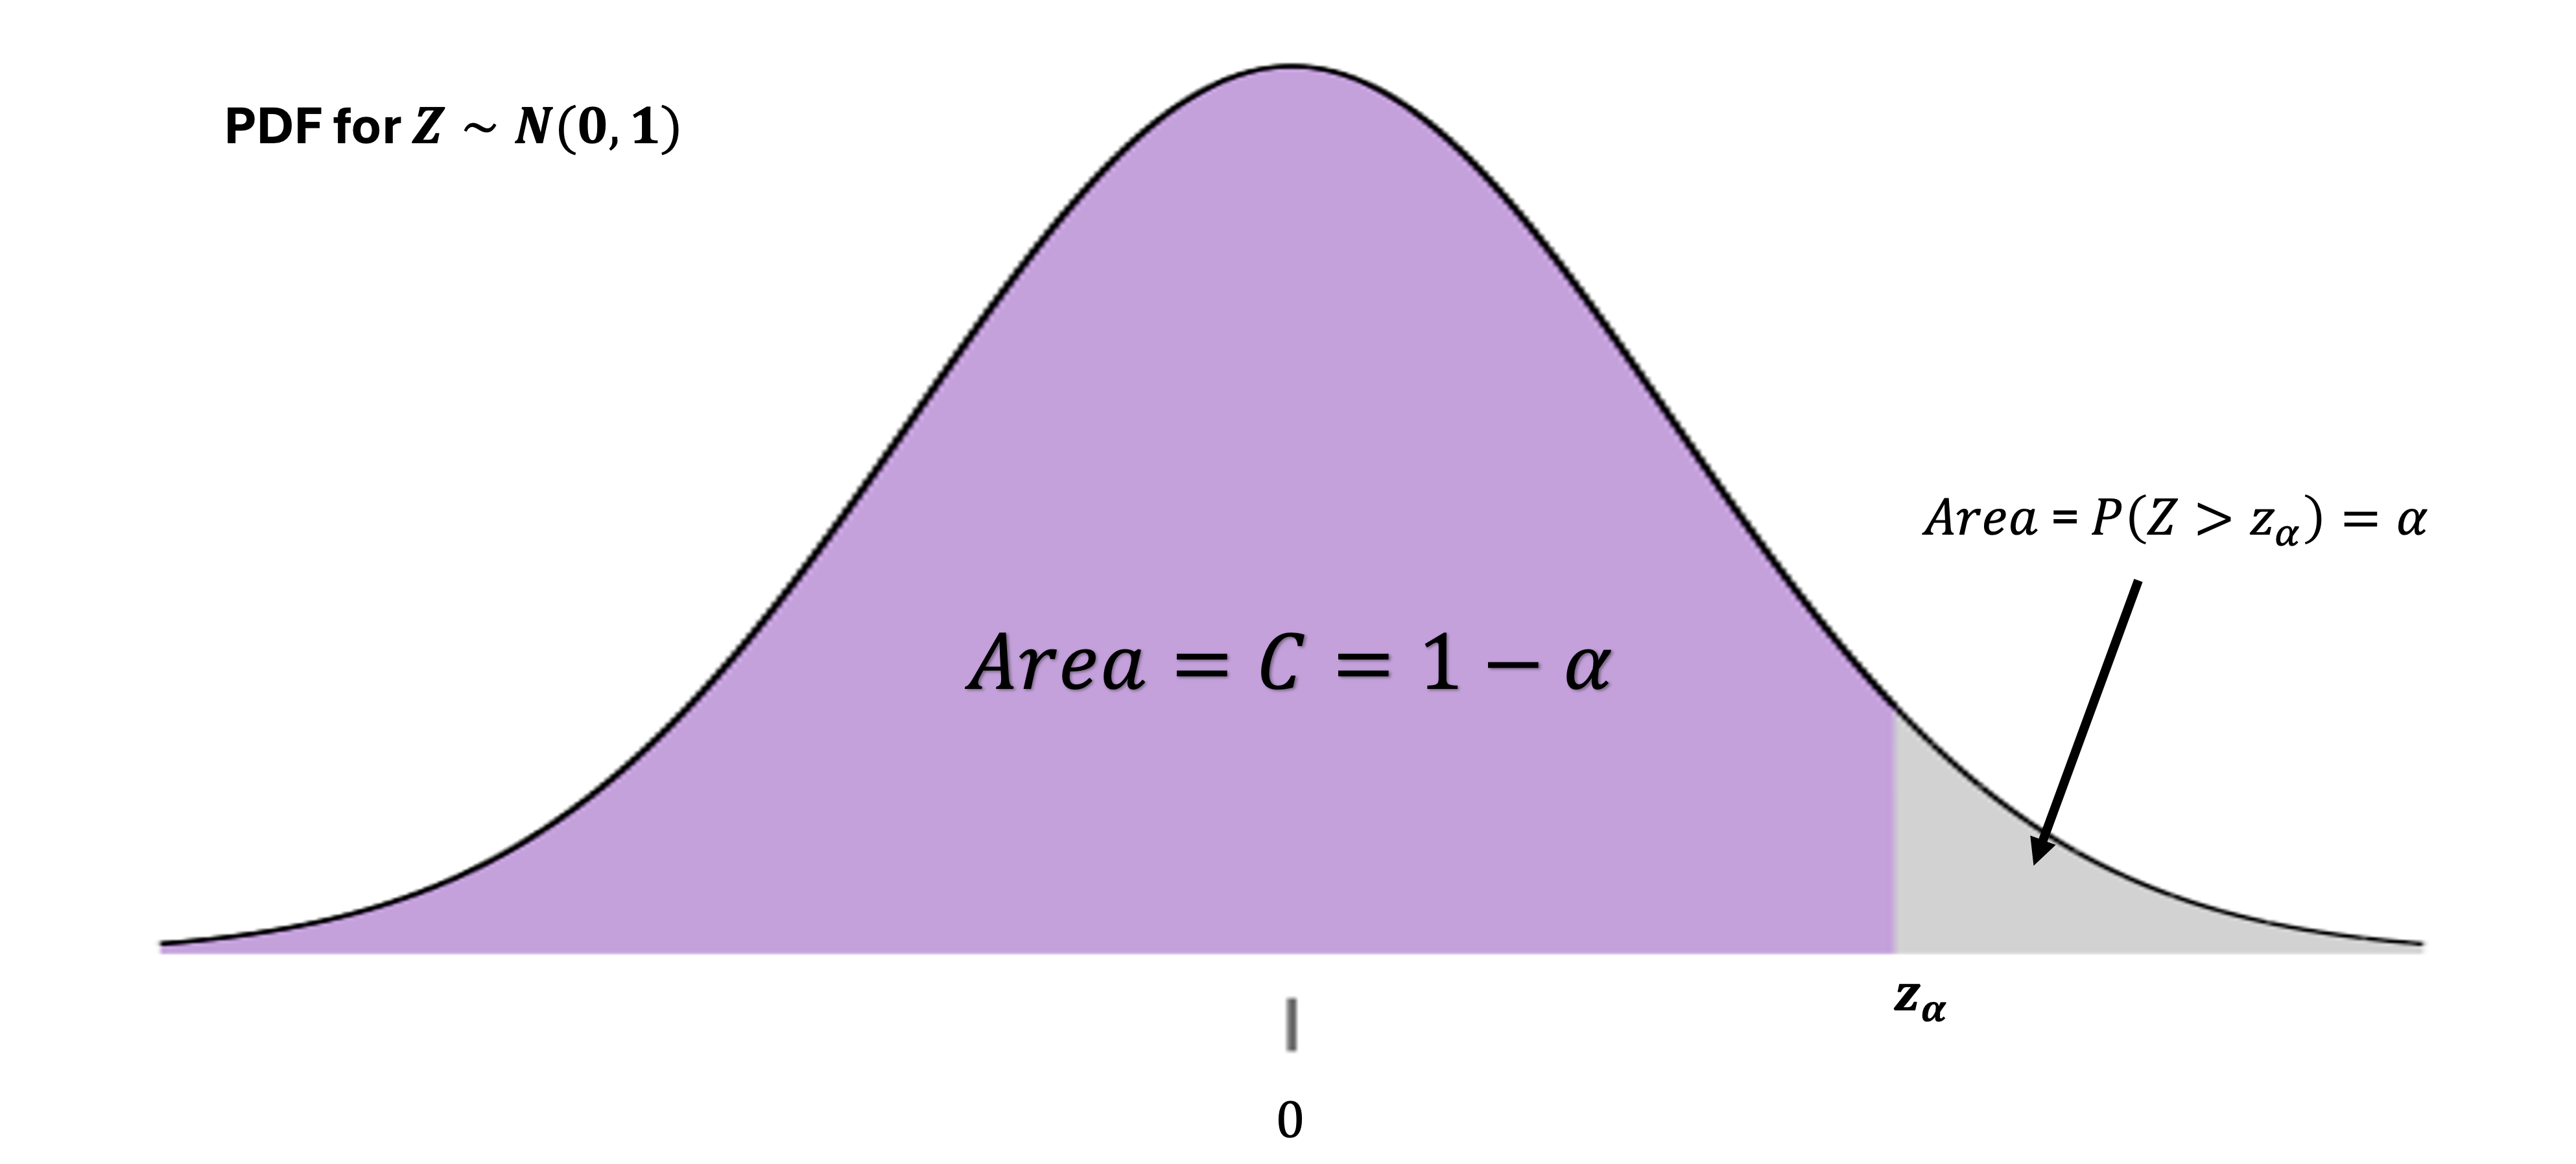
Note that \(z_\alpha\) also satisfies \(P(Z < z_\alpha) = C\).
The Assumptions
The assumptions required for validity of the construction is identical to the two-sided case:
\(X_1, X_2, \ldots, X_n\) form an iid sample from the population, \(X\). The expected value and variance of \(X\) is denoted \(\mu\) and \(\sigma^2\), respectively.
Either the population is normally distributed, or we have sufficiently large \(n\) for the CLT to hold.
The population variance \(\sigma^2\) is known.
It follows that the pivotal quantity has the standard normal distribution:
The Derivation
We begin with the property of \(z_\alpha\) which holds by its definition:
Replace \(Z\) with the pivotal quantity:
\[P\left(\frac{\bar{X}-\mu}{\sigma/\sqrt{n}} < z_{\alpha}\right) = C\]Multiply both sides by \(\sigma/\sqrt{n}\):
\[P\left(\bar{X}-\mu < z_{\alpha} \frac{\sigma}{\sqrt{n}}\right) = C\]Subtract \(\bar{X}\) from both sides and multiply by -1 (which reverses the inequality):
\[P\left(\mu < \bar{X} + z_{\alpha} \frac{\sigma}{\sqrt{n}}\right) = C\]
This gives us a probability statement with the same structure as our goal.
Derive the lower confidence bound as an independent exercise 🤔
For lower confidence bounds, we are looking for a guarantee that the population mean \(\mu\) is above a threshold with a high probability \(C\). Since it bounds \(\mu\) from below, it will take the general form \(\bar{X}-ME\). Follow the same flow of logic under the same assumptions, making sure to reflect the change in direction.
Summary
The upper confidence bound (UCB) for an observed mean (lower case \(\bar{x}\)) is:
The lower confidence bound (LCB) for an observed mean is:
An Interval Representation of Confidence Bounds
Confidence bounds are sometimes represented as intervals with one endpoint extending to infinity. The respective interval representations of upper and lower confidence bounds are:
Example💡: Lead Content in Drinking Water
An environmental agency samples \(n = 40\) water taps in a neighborhood. Laboratory analysis reports a sample mean lead concentration of \(\bar{x} = 12.7\) ppb (parts per billion). Historical data suggest the population standard deviation is \(\sigma = 4.5\) ppb. The Environmental Protection Agency (EPA) action level for lead in drinking water is \(15\) ppb.
Using 95% confidence level, construct the appropriate confidence region to answer the question: “Is the mean lead level in this neighborhood safely below the EPA action limit?”
Which confidence region is appropriate?
The goal is to establish an upper boundary which marks a safe zone for the true mean lead concentration level. We will construct a 95% upper confidence bound.
The building blocks
\(\sigma = 4.5\)
\(n=40\)
\(\alpha = 1-C = 0.05\)
Step 1: Compute the critical value
This result can be obtained by running qnorm(0.05, lower.tail=FALSE) on R.
Step 2: Calculate the margin of error
Step 3: Determine the upper bound
Interpretation: We are 95% confident that the true mean lead level in the neighborhood is below 13.87 ppb, which is less than the EPA action limit of 15 ppb. This provides statistical evidence that the neighborhood’s water supply is in compliance with EPA standards.
9.7.3. Comparison of Confidence Intervals and Bounds
It is important to note that a confidence bound does not coincide with either endpoint of the confidence interval at the same confidence level. The table below summarizes the key differences:
Property |
Confidence Interval |
Confidence Bound |
|---|---|---|
Critical value |
\(z_{\alpha/2}\) |
\(z_\alpha\) |
Margin of error |
\(z_{\alpha/2}\frac{\sigma}{\sqrt{n}}\) |
\(z_{\alpha}\frac{\sigma}{\sqrt{n}}\) |
Size of ME |
Always greater than CB |
Always smaller than CI |
The size difference in the MEs arises naturally from the definitions of their critical values. \(z_\alpha\) must leave out an area twice as large as \(z_{\alpha/2}\) in the upper region of the standard normal pdf. Therefore, it must locate itself closer to 0, resulting in a smaller value than \(z_{\alpha/2}\) (Fig. 9.7).
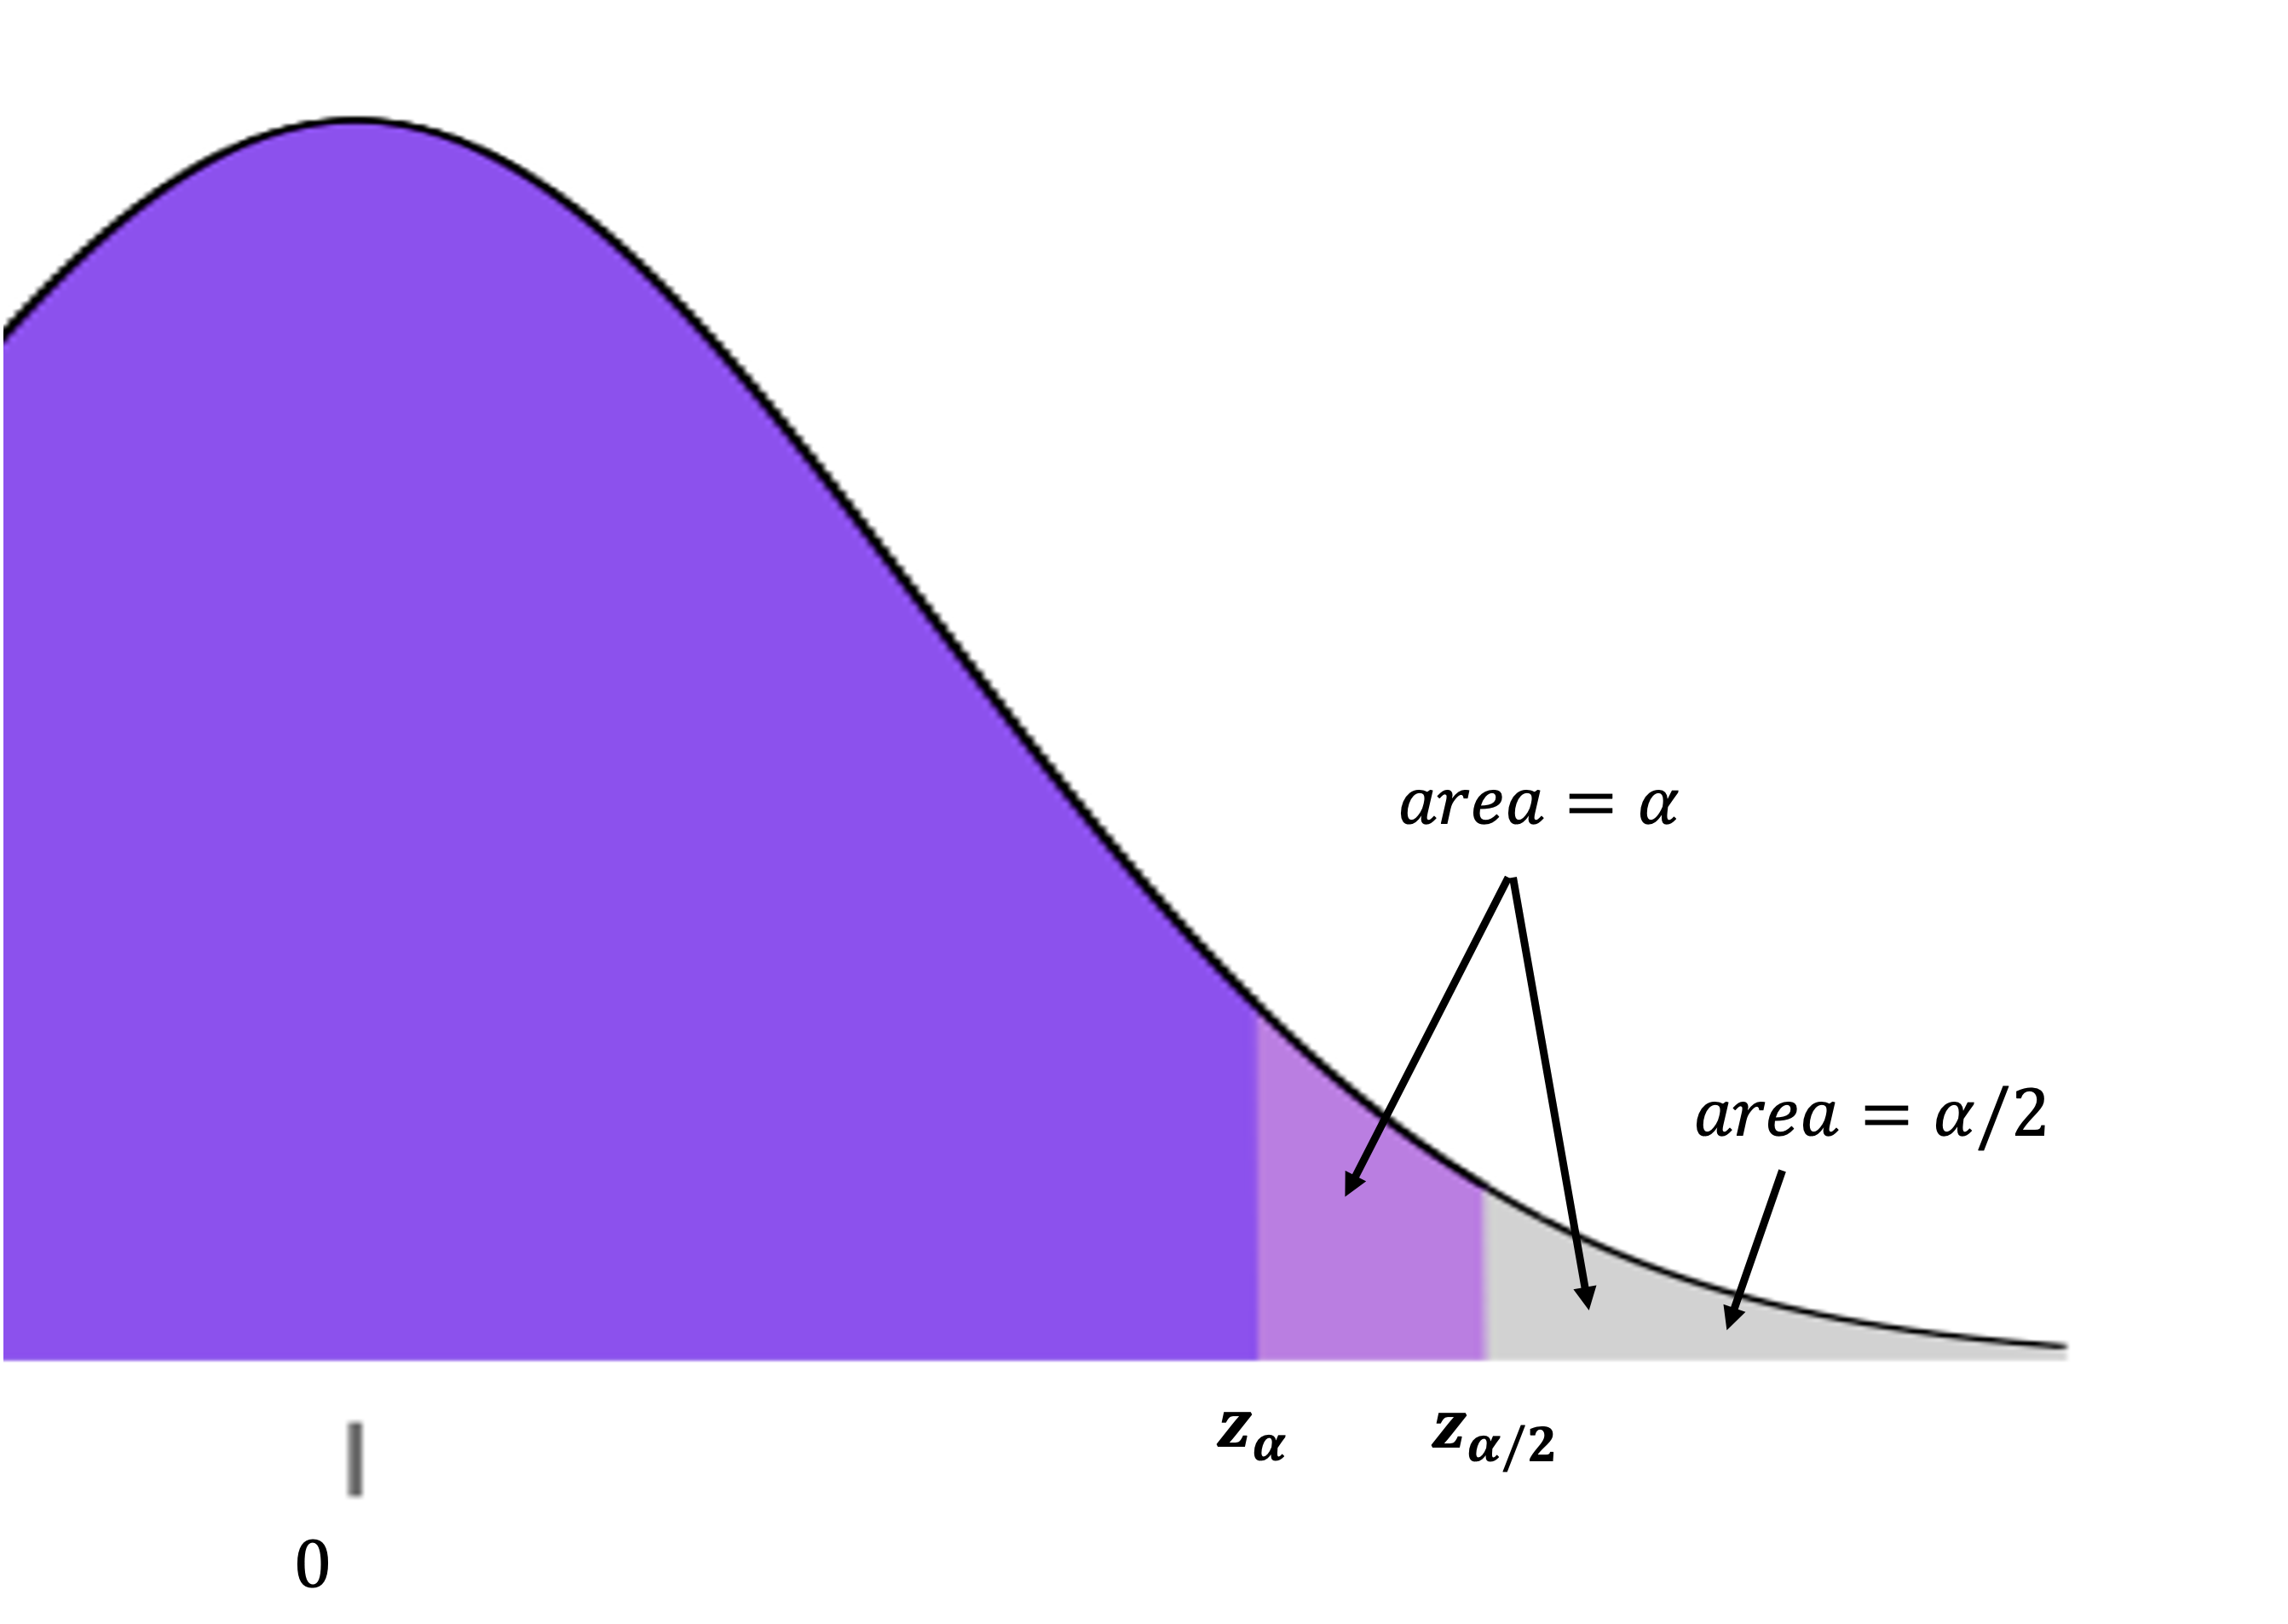
Fig. 9.7 Comparison of critical values for \(\alpha\) and \(\alpha/2\)
The table below compares the computed values of \(z_\alpha\) and \(z_{\alpha/2}\) for several commonly used \(C= 1-\alpha\):
Confidence Level |
One-sided \(z_{\alpha}\) |
Two-sided \(z_{\alpha/2}\) |
|---|---|---|
90% |
1.282 |
1.645 |
95% |
1.645 |
1.960 |
99% |
2.326 |
2.576 |
This means that under identical experimental conditions (\(C, \sigma\), and \(n\)), a confidence bound will always provide a more precise result than a confidence interval on the side of interest. By concentrating the available resources on a single side rather than splitting them between both bounds, a confidence bound achieves greater efficiency whenever applicable.
Choosing Between Bounds and Intervals
The choice between a one-sided bound and a two-sided interval should be made based on the scientific question, not on which approach gives more favorable results. You may use the guidelines below.
Match the research question: Use one-sided bounds when the research question naturally has a directional component.
Avoid post-hoc selection: Make the decision before collecting or analyzing any data. Choosing the most favorable confidence region after evaluating all possible candidates undermines the validity of the stated confidence level.
9.7.4. Bringing It All Together
Key Takeaways 📝
One-sided confidence bounds are appropriate when the research question involves a directional concern about a parameter.
An upper confidence bound (UCB) \(\bar{x} + z_{\alpha} \frac{\sigma}{\sqrt{n}}\) provides a value that the parameter likely falls below.
A lower confidence bound (LCB) \(\bar{x} - z_{\alpha} \frac{\sigma}{\sqrt{n}}\) provides a value that the parameter likely exceeds.
One-sided bounds use different critical values from two-sided intervals at the same confidence level.
The type of confidence region must be chosen to align with the research question, before collecting and analyzing the data.
Exercises
A battery manufacturer wants to ensure that the mean battery life exceeds \(40\) hours. A sample of \(25\) batteries has a mean life of \(42.3\) hours. Assuming \(\sigma = 5\) hours is known from extensive testing, construct an appropriate 95% confidence region for the mean battery life and formally interpret the result. Does this provide evidence that the mean exceeds \(40\) hours?
Environmental regulations require that the mean concentration of a pollutant in factory discharge not exceed \(3.5\) ppm. A random sample of \(36\) discharge measurements yields \(\bar{x} = 3.2\) ppm. If \(\sigma = 0.8\) ppm, construct an appropriate 99% confidence region and formally interpret the result. Does the factory appear to be in compliance?
Exercises: Confidence Bounds (σ Known)
Learning Objectives 🎯
These exercises will help you:
Understand when to use one-sided confidence bounds vs two-sided intervals
Construct upper confidence bounds (UCB) and lower confidence bounds (LCB)
Recognize the difference between \(z_{\alpha}\) and \(z_{\alpha/2}\)
Apply confidence bounds to compliance and specification problems
Compare the precision of bounds vs intervals
Key Formulas 📐
Upper Confidence Bound (UCB):
Interpretation: We are \(C\%\) confident that \(\mu \leq UCB\).
Lower Confidence Bound (LCB):
Interpretation: We are \(C\%\) confident that \(\mu \geq LCB\).
Key difference: One-sided bounds use \(z_{\alpha}\), not \(z_{\alpha/2}\).
# For 95% confidence
z_alpha <- qnorm(0.05, lower.tail = FALSE)    # 1.645 for bounds
z_alpha2 <- qnorm(0.025, lower.tail = FALSE)  # 1.960 for CI
9.7.5. Exercises
Exercise 1: UCB vs LCB Selection
For each scenario, determine whether an upper confidence bound (UCB), lower confidence bound (LCB), or two-sided CI is most appropriate. Explain your reasoning.
An environmental agency wants to verify that mean pollutant levels do not exceed a safety threshold.
A battery manufacturer wants to demonstrate that mean battery life meets a minimum specification.
A researcher is estimating mean blood pressure with no directional hypothesis.
A pharmaceutical company must show that mean drug concentration does not drop below a therapeutic level.
An engineer wants to ensure mean component weight does not exceed a design limit.
Solution
Part (a): UCB
The concern is that pollutant levels might be too high. An UCB provides confidence that the true mean is at most some value. If UCB < threshold, compliance is demonstrated.
Part (b): LCB
The concern is that battery life might be too low. An LCB provides confidence that the true mean is at least some value. If LCB > minimum spec, the specification is met.
Part (c): Two-sided CI
No directional concern—we simply want to estimate the mean with precision on both sides.
Part (d): LCB
The concern is that concentration might be too low (below therapeutic level). An LCB showing the mean is at least the therapeutic level demonstrates efficacy.
Part (e): UCB
The concern is weight might be too high. An UCB provides confidence that mean weight is at most some value.
Rule of thumb: - “At most” / “does not exceed” / “below threshold” → UCB - “At least” / “meets minimum” / “above threshold” → LCB - No directional interest → Two-sided CI
Exercise 2: Computing Critical Values
Find the appropriate critical value for each scenario. Specify whether you use \(z_{\alpha}\) or \(z_{\alpha/2}\).
95% confidence interval (two-sided)
95% upper confidence bound (one-sided)
95% lower confidence bound (one-sided)
99% confidence interval (two-sided)
90% upper confidence bound (one-sided)
Explain why the critical value for a 95% UCB is smaller than for a 95% CI.
Solution
Part (a): 95% CI (two-sided)
Use \(z_{\alpha/2} = z_{0.025} = 1.960\)
Part (b): 95% UCB (one-sided)
Use \(z_{\alpha} = z_{0.05} = 1.645\)
Part (c): 95% LCB (one-sided)
Use \(z_{\alpha} = z_{0.05} = 1.645\)
Part (d): 99% CI (two-sided)
Use \(z_{\alpha/2} = z_{0.005} = 2.576\)
Part (e): 90% UCB (one-sided)
Use \(z_{\alpha} = z_{0.10} = 1.282\)
Part (f): Why 95% UCB critical value is smaller
For a two-sided 95% CI, we split the 5% error between both tails (2.5% each), requiring \(z_{0.025} = 1.96\).
For a one-sided 95% UCB, the entire 5% error is in one tail, requiring only \(z_{0.05} = 1.645\).
This makes the bound tighter (closer to \(\bar{x}\)) on the side of interest.
R verification:
qnorm(0.025, lower.tail = FALSE)  # 1.960 for 95% CI
qnorm(0.05, lower.tail = FALSE)   # 1.645 for 95% bound
qnorm(0.005, lower.tail = FALSE)  # 2.576 for 99% CI
qnorm(0.10, lower.tail = FALSE)   # 1.282 for 90% bound
Exercise 3: Constructing a UCB
An EPA inspector tests water quality at a treatment plant. Based on \(n = 40\) samples, the mean lead concentration is \(\bar{x} = 12.7\) ppb. The population standard deviation is \(\sigma = 4.5\) ppb from historical records.
Construct a 95% upper confidence bound for the mean lead concentration.
The EPA safety threshold is 15 ppb. Based on your UCB, is there evidence that the water meets safety standards?
Construct a 99% UCB. Does the conclusion change?
Write a complete interpretation of your 95% UCB in context.
Solution
Given: \(n = 40\), \(\bar{x} = 12.7\) ppb, \(\sigma = 4.5\) ppb
\(SE = \frac{4.5}{\sqrt{40}} = 0.711\) ppb
Part (a): 95% UCB
\(z_{0.05} = 1.645\)
Part (b): Compliance check
UCB (13.87 ppb) < 15 ppb threshold. Yes, there is evidence the water meets safety standards at 95% confidence.
Part (c): 99% UCB
\(z_{0.01} = 2.326\)
UCB (14.35 ppb) < 15 ppb. Conclusion doesn’t change—water still meets standards.
Part (d): Interpretation
We are 95% confident that the true mean lead concentration in water from this treatment plant is at most 13.87 ppb. Since this upper bound is below the EPA safety threshold of 15 ppb, we have statistical evidence that the water meets safety requirements.
R verification:
xbar <- 12.7; sigma <- 4.5; n <- 40
SE <- sigma / sqrt(n)  # 0.711

# 95% UCB
xbar + qnorm(0.05, lower.tail = FALSE) * SE  # 13.87

# 99% UCB
xbar + qnorm(0.01, lower.tail = FALSE) * SE  # 14.35
Exercise 4: Constructing an LCB
A battery manufacturer claims their batteries have a mean lifetime of at least 480 hours. Quality control tests \(n = 36\) batteries, finding \(\bar{x} = 492\) hours. Historical data shows \(\sigma = 30\) hours.
Construct a 95% lower confidence bound for mean battery life.
Does the LCB support the manufacturer’s claim of at least 480 hours?
Construct a 99% LCB. Does the conclusion change?
What sample size would be needed for the 95% LCB to be exactly 480 hours (given the same \(\bar{x}\))?
Solution
Given: \(n = 36\), \(\bar{x} = 492\) hours, \(\sigma = 30\) hours
\(SE = \frac{30}{\sqrt{36}} = 5\) hours
Part (a): 95% LCB
\(z_{0.05} = 1.645\)
Part (b): Claim evaluation
LCB (483.77 hours) > 480 hours. Yes, the LCB supports the manufacturer’s claim at 95% confidence.
Part (c): 99% LCB
\(z_{0.01} = 2.326\)
LCB (480.37 hours) > 480 hours. Claim is still supported, but just barely.
Part (d): Required n for LCB = 480
Caution: This calculation treats \(\bar{x} = 492\) as fixed. In practice, \(\bar{x}\) is a random quantity that varies with each sample. For planning purposes, you would typically plan based on a target difference from the threshold and an assumed value for \(\mu\), not a specific observed \(\bar{x}\).
Exercise 5: CI vs Confidence Bounds Comparison
Using the data from Exercise 4 (\(\bar{x} = 492\), \(\sigma = 30\), \(n = 36\)):
Construct a 95% confidence interval.
Compare the lower bound of the CI to the 95% LCB from Exercise 4.
Compare the upper bound of the CI to a 95% UCB.
Which provides a tighter bound on each side: the CI or the one-sided bound? Explain why.
Solution
Given: \(\bar{x} = 492\), \(\sigma = 30\), \(n = 36\), \(SE = 5\)
Part (a): 95% CI
\(z_{0.025} = 1.96\)
Part (b): Lower bound comparison
CI lower bound: 482.20 hours
95% LCB: 483.77 hours
The LCB is higher (tighter) than the CI lower bound.
Part (c): Upper bound comparison
95% UCB: \(492 + 1.645 \times 5 = 500.23\) hours
CI upper bound: 501.80 hours
95% UCB: 500.23 hours
The UCB is lower (tighter) than the CI upper bound.
Part (d): Explanation
One-sided bounds provide tighter limits on the side of interest because they use \(z_{\alpha}\) instead of \(z_{\alpha/2}\):
\(z_{0.05} = 1.645 < z_{0.025} = 1.96\)
By “spending” all the error probability on one side, we get a more precise statement about that side. The tradeoff is we lose information about the other side.
Exercise 6: Environmental Compliance
A factory’s wastewater discharge is tested for chemical concentration. Regulations require the mean concentration to be below 3.5 ppm. From \(n = 50\) samples, \(\bar{x} = 3.2\) ppm with \(\sigma = 0.6\) ppm.
Construct a 95% UCB for the mean concentration.
Does the factory demonstrate compliance with the regulation?
Construct a 99% UCB. Does the conclusion change?
What is the probability of incorrectly concluding compliance if the true mean is exactly 3.5 ppm?
Solution
Given: \(n = 50\), \(\bar{x} = 3.2\) ppm, \(\sigma = 0.6\) ppm, limit = 3.5 ppm
\(SE = \frac{0.6}{\sqrt{50}} = 0.0849\) ppm
Part (a): 95% UCB
Part (b): Compliance
Yes, the 95% UCB (3.34 ppm) is below the 3.5 ppm limit, providing evidence of compliance.
Part (c): 99% UCB
Still in compliance (3.40 < 3.5 ppm). Conclusion doesn’t change.
Part (d): Probability of incorrect conclusion
If the true mean is exactly 3.5 ppm, the UCB will be below 3.5 ppm whenever \(\bar{x} + z_{0.05} \times SE < 3.5\).
Since \(\bar{X} \sim N(3.5, SE^2)\), the probability of \(\bar{X} < 3.5 - 0.140 = 3.36\):
There’s a 5% probability of incorrectly concluding compliance when the true mean exactly equals the limit. This is the Type I error rate.
Exercise 7: Aerospace Materials
An aerospace company requires composite materials to have mean tensile strength at least 800 MPa. A sample of \(n = 30\) specimens yields \(\bar{x} = 835\) MPa with \(\sigma = 55\) MPa.
Construct a 95% LCB for mean tensile strength.
Does the material meet the specification?
Construct a 99% LCB. Does the conclusion change?
Write a complete interpretation in context.
Solution
Given: \(n = 30\), \(\bar{x} = 835\) MPa, \(\sigma = 55\) MPa, requirement = 800 MPa
\(SE = \frac{55}{\sqrt{30}} = 10.04\) MPa
Part (a): 95% LCB
Part (b): Specification check
Yes, the 95% LCB (818.48 MPa) exceeds the minimum requirement (800 MPa), providing evidence that the material meets specifications.
Part (c): 99% LCB
Still meets requirement (811.65 > 800 MPa). Conclusion doesn’t change.
Part (d): Interpretation
We are 95% confident that the true mean tensile strength of this composite material exceeds 818.48 MPa. Since this lower bound is above the minimum specification of 800 MPa, we have statistical evidence that the material meets the aerospace company’s strength requirements.
Exercise 8: Temperature Control
A data center requires server room temperature to be between 70°C and 85°C. From \(n = 45\) measurements, \(\bar{x} = 78.5°C\) with \(\sigma = 8°C\).
Construct a 95% UCB for mean temperature.
Construct a 95% LCB for mean temperature.
Based on both bounds, does the temperature control meet specifications?
What is the relationship between these two separate 95% bounds and a 95% two-sided CI?
Solution
Given: \(n = 45\), \(\bar{x} = 78.5°C\), \(\sigma = 8°C\)
\(SE = \frac{8}{\sqrt{45}} = 1.193°C\)
Part (a): 95% UCB
Part (b): 95% LCB
Part (c): Specification check
UCB (80.46°C) < 85°C ✓ (meets upper limit)
LCB (76.54°C) > 70°C ✓ (meets lower limit)
Yes, both specifications are met.
Part (d): Relationship to two-sided CI
These are two separate 95% bounds, not a 95% two-sided interval. Each bound independently provides 95% confidence.
Important note: Two separate 95% one-sided bounds together correspond to at least 90% joint confidence (since each bound has 5% error probability), not 95%. If you want a single 95% two-sided interval, compute the usual 95% CI using \(z_{0.025} = 1.96\):
Exercise 9: Expressing Bounds as Intervals
Express each confidence bound as an interval using proper notation.
95% UCB = 13.87 ppb
95% LCB = 476.02 hours
99% UCB = 142.5 mg/dL
90% LCB = 2850 MPa
Solution
Part (a): UCB = 13.87 ppb
Or equivalently: \(\mu \leq 13.87\) ppb with 95% confidence.
Part (b): LCB = 476.02 hours
Or equivalently: \(\mu \geq 476.02\) hours with 95% confidence.
Part (c): UCB = 142.5 mg/dL
Part (d): LCB = 2850 MPa
9.7.6. Additional Practice Problems
True/False Questions (1 point each)
An upper confidence bound uses \(z_{\alpha/2}\).
Ⓣ or Ⓕ
A 95% LCB is higher (closer to x̄) than the lower bound of a 95% CI.
Ⓣ or Ⓕ
Use an LCB when you want to show a parameter is at least some value.
Ⓣ or Ⓕ
Two separate 95% one-sided bounds provide 95% joint confidence.
Ⓣ or Ⓕ
\(z_{0.05} < z_{0.025}\) for standard normal distribution.
Ⓣ or Ⓕ
A UCB answers “what is the maximum the parameter could plausibly be?”
Ⓣ or Ⓕ
Multiple Choice Questions (2 points each)
For a 90% upper confidence bound, the critical value is:
Ⓐ \(z_{0.05} = 1.645\)
Ⓑ \(z_{0.10} = 1.282\)
Ⓒ \(z_{0.025} = 1.96\)
Ⓓ \(z_{0.01} = 2.326\)
An EPA inspector wants to verify mean pollution is below a threshold. Which should be used?
Ⓐ Two-sided CI
Ⓑ Lower confidence bound
Ⓒ Upper confidence bound
Ⓓ Either bound works equally well
If \(\bar{x} = 50\), \(\sigma = 10\), \(n = 25\), the 95% UCB is:
Ⓐ 50 + 1.645(2) = 53.29
Ⓑ 50 + 1.96(2) = 53.92
Ⓒ 50 - 1.645(2) = 46.71
Ⓓ 50 + 2.576(2) = 55.15
Compared to a 95% CI, a 95% UCB:
Ⓐ Is always wider
Ⓑ Is always narrower
Ⓒ Has a tighter upper limit
Ⓓ Has a tighter lower limit
A pharmaceutical company wants to show drug concentration exceeds 100 mg/L. They should use:
Ⓐ UCB
Ⓑ LCB
Ⓒ Two-sided CI
Ⓓ Cannot be determined
Why do one-sided bounds use \(z_{\alpha}\) instead of \(z_{\alpha/2}\)?
Ⓐ To make the interval wider
Ⓑ Because all error is allocated to one tail
Ⓒ To increase the confidence level
Ⓓ There is no difference between them
Answers to Practice Problems
True/False Answers:
False — UCB uses \(z_{\alpha}\) (one-sided), not \(z_{\alpha/2}\) (two-sided).
True — LCB uses \(z_{0.05} = 1.645\) while CI uses \(z_{0.025} = 1.96\), so LCB is closer to x̄.
True — LCB provides confidence that μ ≥ LCB value.
False — Two 95% one-sided bounds provide at least 90% joint confidence, not 95%.
True — \(z_{0.05} = 1.645 < z_{0.025} = 1.96\).
True — UCB gives the upper limit of plausible values for μ.
Multiple Choice Answers:
Ⓑ — 90% bound means α = 0.10, so use \(z_{0.10} = 1.282\).
Ⓒ — To show pollution is below a threshold, demonstrate that UCB < threshold.
Ⓐ — UCB = x̄ + z₀.₀₅(σ/√n) = 50 + 1.645(10/5) = 53.29.
Ⓒ — UCB has a tighter upper limit because it uses z₀.₀₅ < z₀.₀₂₅.
Ⓑ — To show concentration exceeds a value, demonstrate LCB > threshold.
Ⓑ — One-sided bounds allocate all α error to one tail.