Slides 📊
8.6. Sampling Design
How we select experimental units for our studies fundamentally determines whether our conclusions can be generalized beyond the specific individuals we observe. The transition from experimental design to sampling design marks a shift from internal validity to external validity. While experimental design principles ensure that our comparisons are fair and unbiased, sampling design principles ensure that our participants represent the population we want to understand.
Road Map 🧭
Understand that certain assumptions for valid statistical inference can only be satisfied through careful sampling design.
Recognize the serious limitations of non-random sampling methods, which often introduce bias in the sample.
Learn the definitions of two major random sampling methods—Simple Random Sampling and Stratified Random Sampling—and understand the advantages and limitations of each.
8.6.1. Why Does the Sampling Design Matter?
The Connection to IID Assumptions
The mathematical tools we use for drawing conclusions all depend on specific assumptions about how our data are collected. When these assumptions are violated, even the most sophisticated analysis can produce misleading results.
In particular, most statistical inference procedures covered in this course rely on the Central Limit Theorem, which assumes that the observations are independent and identically distributed (iid). This condition can only be ensured during the sampling stage.
The Population-Sample-Population Cycle
Statistical inference follows a logical cycle that depends entirely on proper sampling design:
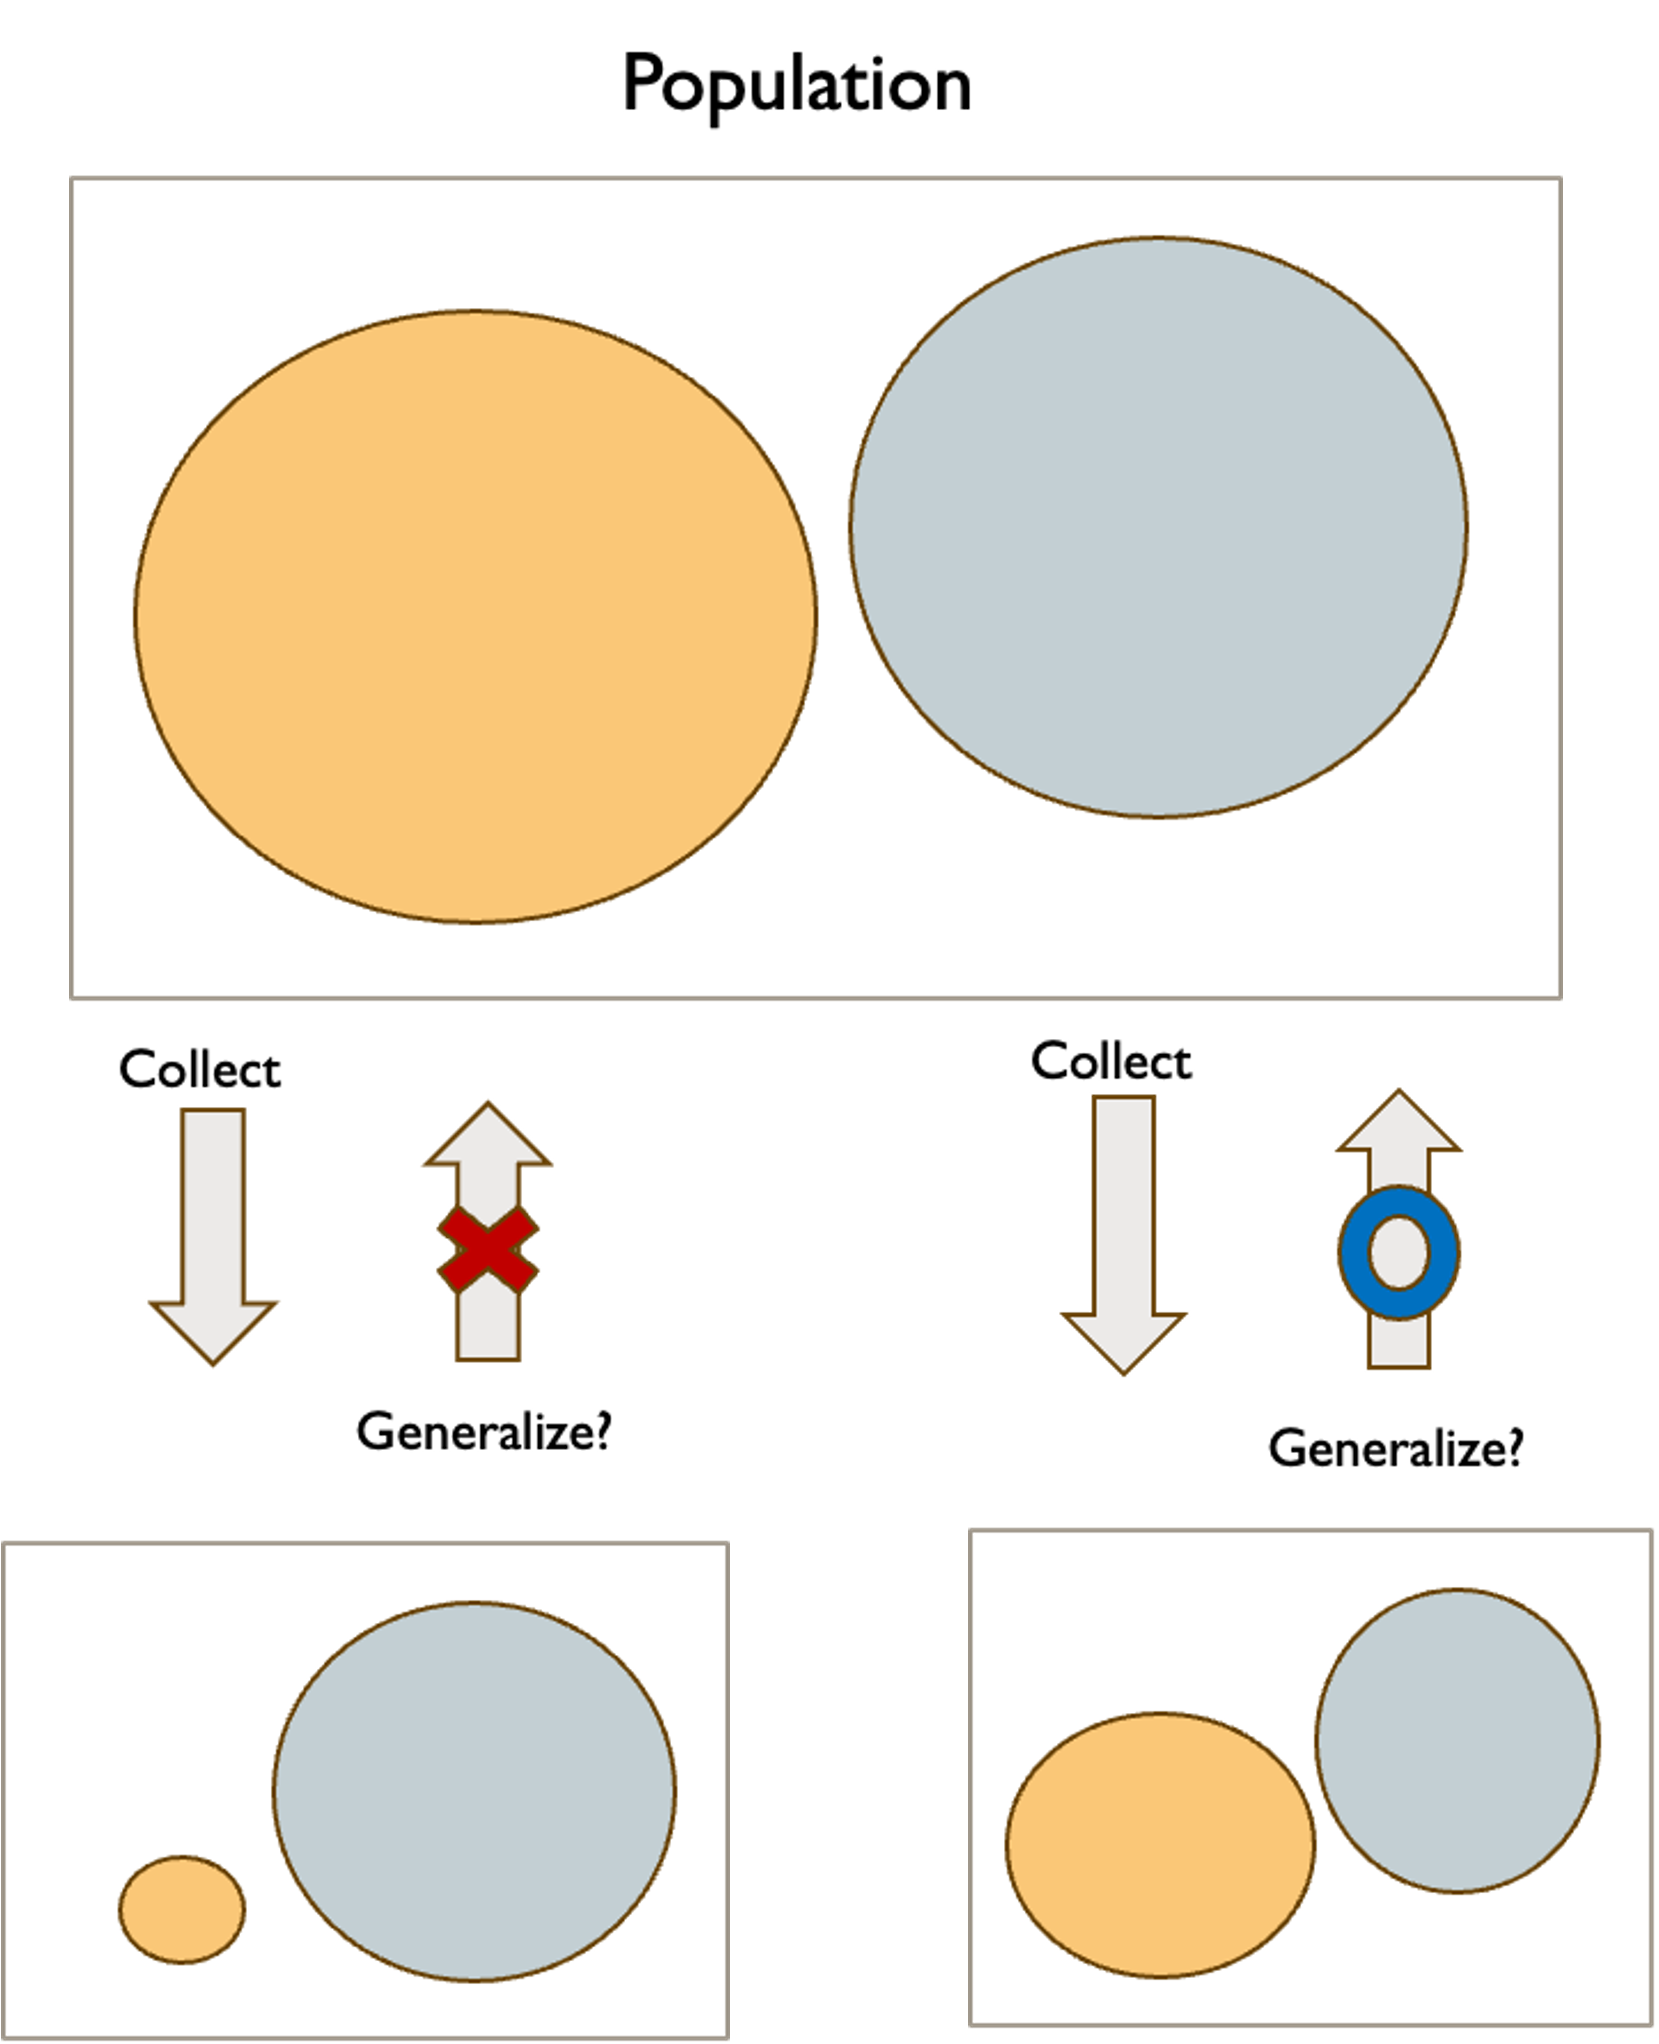
Fig. 8.11 Simple illustration of generalizability
Define the target population we want to understand
Draw a representative sample from that population using appropriate methods
Analyze the sample data using statistical procedures
Generalize results back to the target population with known levels of uncertainty
Each step depends on the previous ones. If our sample is not representative of the target population (step 2), then our analysis (step 3) and conclusions (step 4) will be invalid, no matter how sophisticated the statistical methods are.
8.6.2. Non-Random Sampling Methods: Understanding the Limitations
Convenience Sampling
Convenience sampling selects participants based solely on ease of access and availability. This approach is attractive because it is simple, fast, and inexpensive to implement, but it almost certainly introduces a bias.
Example 💡: Convenience Sampling
Academic Research: A psychology professor studies decision-making by recruiting students from her own classes. While convenient, this sample only represents college students in that particular major at that specific institution.
Medical Research: A doctor studies the effectiveness of a new treatment by enrolling patients who visit his clinic. This sample may systematically exclude people who can’t afford medical care, live far from the clinic, or prefer different healthcare providers.
Market Research: A company surveys customers who visit their website or respond to email invitations. This approach misses potential customers who don’t engage with the company online.
Political Polling: News outlets conduct “person on the street” interviews in busy downtown areas. Such samples systematically overrepresent people who work downtown, have flexible schedules, and are comfortable talking to reporters.
Voluntary Response Sampling
Voluntary response sampling occurs when individuals self-select into the study based on their own willingness or motivation to participate.
Example 💡: Voluntary Response
Political Issues: When news programs ask viewers to call in with their opinions on political topics, respondents typically have much stronger views than the general population. The results often show more extreme positions than scientific polls of the same topics.
Product Reviews: Online product reviews suffer from voluntary response bias because people with very positive or very negative experiences are much more likely to write reviews than those with neutral experiences.
Comment Sections: Online comment sections on news articles or social media posts systematically overrepresent people with strong opinions and those comfortable expressing views in public forums.
Limitations of Non-random Sampling
As seen in each example, non-random sampling methods are highly likely to produce bias in the observed sample. While these techniques can be useful for generating hypotheses or conducting preliminary studies, researchers should exercise caution when interpreting the validity of analyses based on data collected through non-random methods.
8.6.3. Random Sampling Methods: The Foundation of Valid Inference
Randomization in sampling serves the same fundamental purpose as randomization in experimental design: it removes systematic bias and replaces it with known, manageable random variation. When we can’t control all the factors that might affect who ends up in our sample, randomization ensures that these factors balance out across many possible samples.
Key Properties of Random Sampling
Known Selection Probabilities: For every member of the population, we can calculate the probability that they’ll be included in our sample. This probabilistic foundation enables statistical inference.
Unbiased Selection: The sampling process doesn’t systematically favor any particular type of person or outcome. Any biases that remain are due to random chance rather than systematic factors.
Quantifiable Uncertainty: Because we understand the probabilistic mechanism that generated our sample, we can calculate the uncertainty associated with our estimates and test results.
Reproducible Methods: Random sampling procedures can be described precisely and replicated by other researchers, enabling scientific verification of results.
Independence: When properly implemented, random sampling ensures that the selection of one unit has no (or minimal) influence on the probability of selecting any other unit.
A. Simple Random Sampling: The Gold Standard
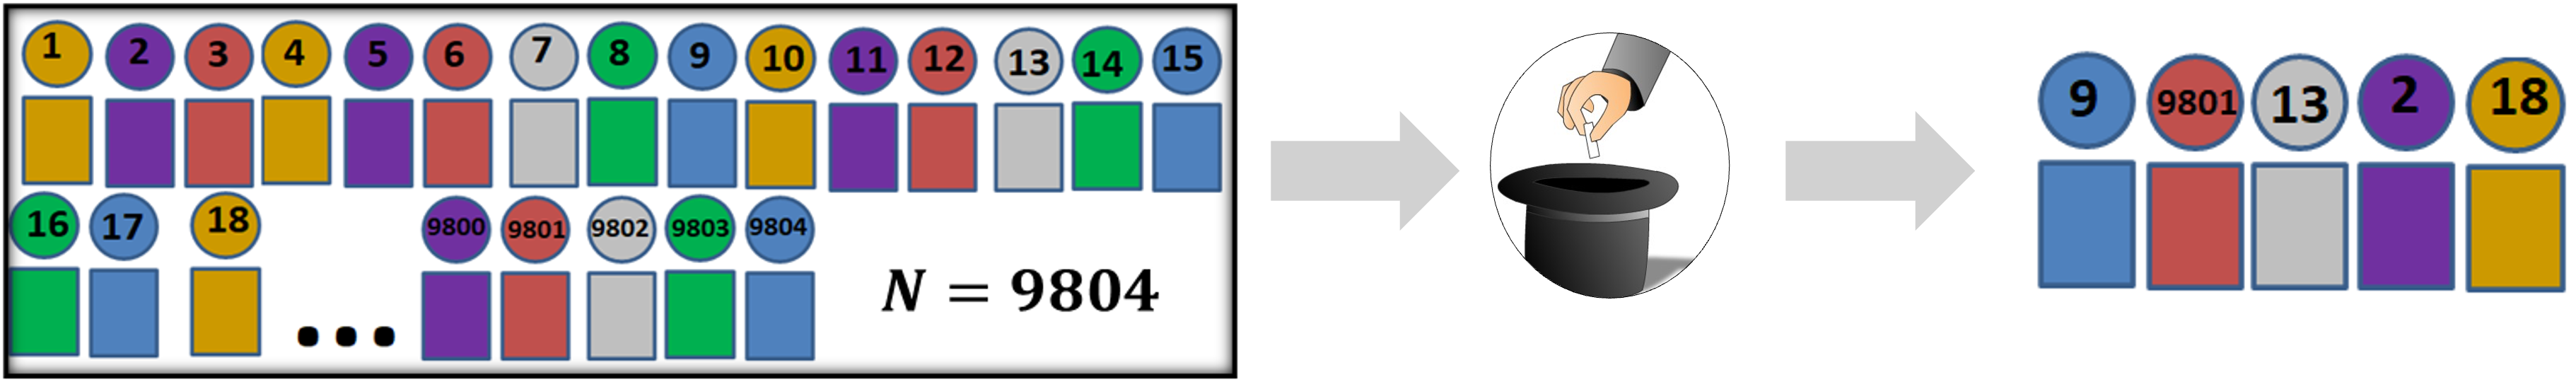
Fig. 8.12 Simple Random Sampling
In Simple Random Sampling (SRS), every possible unit in the population has exactly the same probability of being selected, and every possible sample of a given size has exactly the same probability of being chosen.
Implementation Procedure
Suppose a simple random sample of size \(n\) is to be taken from a population of size \(N\).
Step 1: Define the target population.
Step 2: Give each unit in the population a unique identifier. This can be done through:
Sequential numbering (1, 2, 3, …, N)
Existing ID numbers (SSN, student ID, account numbers)
Systematic codes that preserve anonymity while maintaining uniqueness
Step 3: Use a random process to select which identifiers will be included. In this step,
Every individual in the population should have probability \(\frac{n}{N}\) of being included in the sample.
Equivalently, every possible sample of size \(n\) should have probability \(1/\binom{N}{n}\) of being selected.
B. Stratified Random Sampling: Balancing Representation and Efficiency
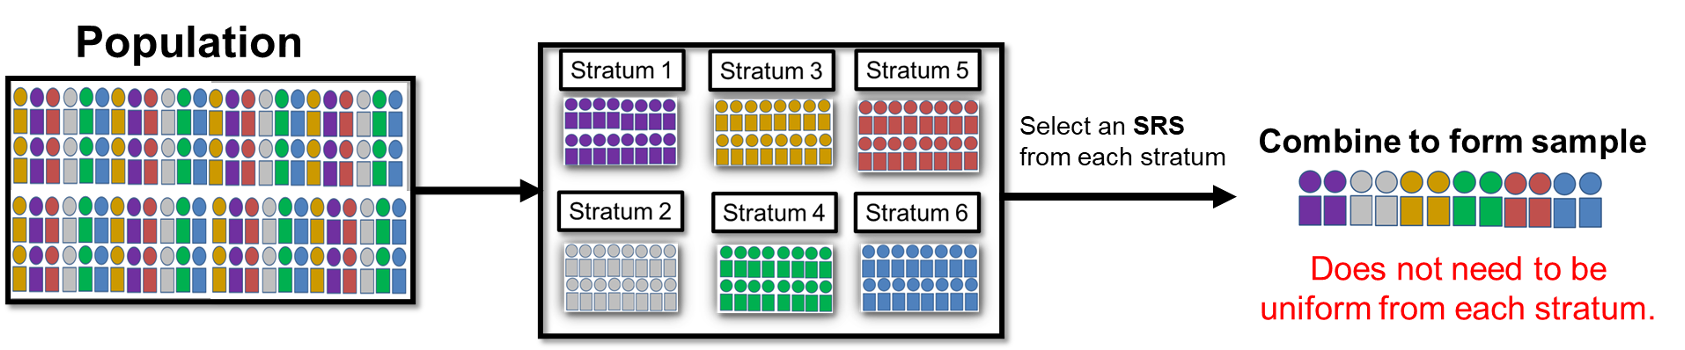
Fig. 8.13 Stratified Random Sampling
When a population contains important subgroups that differ substantially from each other, stratified random sampling provides a method for ensuring adequate representation of all subgroups. It divides the population into strata (subgroups) based on characteristics known before sampling, then gathers separate simple random samples within each stratum.
The sizes of the sub-samples may be uniform or vary across strata. When they differ, the allocation is often proportional to the relative sizes of the strata in the population.
Comparison of the Two Random Sampling Methods
Method |
Advantages |
Limitations |
|---|---|---|
Simple Random Sampling |
It is simple in construction. |
It can miss a rare but significant subgroup from the population when the sample size is not large enough. |
Stratified Random Sampling |
It can ensure representation of important subgroups in the population. |
It requires more planning than simple random sampling.
|
8.6.4. Bringing It All Together
Key Takeaways 📝
The sampling methods fundamentally determine whether statistical inference procedures are valid and whether results can be generalized.
Non-random sampling methods are often simple and cheap but introduce biases, limiting their use to preliminary investigations.
Random sampling methods provide the probabilistic foundation required for statistical inference procedures.
Simple random sampling assigns equal selection probability to every member of a population. It satisfies the iid assumption required by most statistical procedures.
When populations contain distinct subgroups, stratified random sampling can be used to control the balance among subgroups.
8.6.5. Exercises
These exercises develop your understanding of sampling methods, their properties, and their role in enabling valid statistical inference.
Key Concepts
Why Sampling Design Matters
Many statistical inference procedures assume approximately iid (independent and identically distributed) observations
Random sampling supports these assumptions, especially when the sampling fraction is small (n/N < 10%)
Sampling design determines whether results can be generalized to the population
Population → Sample → Analysis → Generalize back to Population
Important Distinction
Random sampling (from population) → supports generalization to the population
Random assignment (to treatments) → supports causal inference within the study
Non-Random Sampling Methods (prone to bias)
Convenience sampling: Select whoever is easiest to reach
Voluntary response sampling: Participants self-select into the study
Random Sampling Methods (enable valid inference)
Simple Random Sampling (SRS): Every individual has equal probability of selection; every sample of size n has equal probability
Stratified Random Sampling: Divide population into strata (subgroups), then SRS within each stratum
Key Properties of Random Sampling
Known selection probabilities
Unbiased selection (no systematic favoritism)
Quantifiable uncertainty
Independence of selections
Exercise 1: Identifying Sampling Methods
Identify the sampling method used in each scenario: Simple Random Sampling (SRS), Stratified Random Sampling, Convenience Sampling, or Voluntary Response Sampling.
A professor wants to study student satisfaction at her university. She surveys students in her own classes.
A political polling organization obtains a list of all registered voters and uses a random number generator to select 1,500 for phone interviews.
A news website posts a poll asking “Do you support the new tax proposal?” and reports results from 12,000 responses.
A market research firm divides customers into regions (Northeast, Southeast, Midwest, West), then randomly selects 200 customers from each region for a survey.
A health researcher stands outside grocery stores asking shoppers to complete a nutrition survey.
The registrar’s office obtains a list of all 25,000 students and uses software to randomly select 500 for an academic experience survey.
Solution
Part (a): Convenience sampling
The professor selects students who are easily accessible (her own classes). These students may not represent the broader university population — they’re in her specific courses, department, and time slots.
Part (b): Simple Random Sampling (SRS)
A complete list of the target population (registered voters) is available, and a random process is used to select individuals. Each voter has an equal chance of selection.
Part (c): Voluntary Response Sampling
Respondents choose whether to participate. People with strong opinions (especially opposition) are more likely to respond. The 12,000 responses are self-selected, not randomly chosen.
Part (d): Stratified Random Sampling
The population is divided into non-overlapping strata (regions), and SRS is conducted within each stratum. This ensures representation from all regions.
Part (e): Convenience sampling
The researcher approaches whoever is available at that location and time. This excludes people who don’t shop at those stores, shop at different times, or decline to participate.
Part (f): Simple Random Sampling (SRS)
Complete list of target population (all students) with random selection from that list. Each student has probability 500/25,000 = 2% of being selected.
Exercise 2: Limitations of Non-Random Sampling
For each non-random sampling scenario, identify two specific groups that are likely to be underrepresented and explain why this matters for the research question.
A technology company surveys user satisfaction by emailing a survey link to all registered users. (Research question: How satisfied are users with the product?)
A news station asks viewers to call in with their opinion on a local zoning issue. (Research question: What do residents think about the proposed zoning change?)
A psychology researcher recruits participants for a study on decision-making by posting flyers in campus buildings. (Research question: How do adults make financial decisions?)
Solution
Part (a): Email survey to registered users
Underrepresented groups:
Users who rarely check email or have email problems: These users may have different engagement levels and satisfaction. Heavy users who check email frequently are more likely to see and respond.
Dissatisfied users who have stopped using the product: They may have abandoned their accounts or ignore emails from the company. Satisfied active users are more likely to respond.
Why it matters: Satisfaction estimates will be biased upward (response bias from engaged users), giving the company an overly optimistic view.
Part (b): Call-in opinion poll
Underrepresented groups:
People with moderate or neutral opinions: Those with strong opinions (especially opposition) are more motivated to call. The silent majority with mild views won’t participate.
Working adults and people without time: Calling requires time and initiative. Retirees, people who work from home, or those with flexible schedules may be overrepresented.
Why it matters: Results will likely overstate the strength and prevalence of opposition, misleading public officials about actual community sentiment.
Part (c): Campus flyer recruitment
Underrepresented groups:
Non-college adults: The target population is “adults,” but college students are a narrow demographic (younger, more educated, specific socioeconomic contexts). Adults who never attended college, older adults, and working-class adults are excluded.
Adults with full-time jobs or family responsibilities: They don’t walk through campus buildings. Even among university-affiliated adults, busy faculty and staff are less likely than students with flexible schedules.
Why it matters: Financial decision-making varies enormously by age, income, life stage, and experience. College students’ decisions may not generalize to the broader adult population.
Exercise 3: Simple Random Sampling Procedure
A quality control engineer wants to inspect a simple random sample of 50 items from a production run of 2,000 items.
Describe a step-by-step procedure for selecting the sample.
What is the probability that any specific item is included in the sample?
A colleague suggests instead inspecting every 40th item starting from a randomly selected item in positions 1-40. Is this simple random sampling? Why or why not?
Another colleague suggests dividing the 2,000 items into 50 groups of 40, then randomly selecting one item from each group. Is this simple random sampling? Why or why not?
Solution
Part (a): SRS procedure
Create a sampling frame: Assign each of the 2,000 items a unique identifier (e.g., 1 through 2,000).
Use a random selection method: Either: - Use a computer random number generator to select 50 distinct numbers between 1 and 2,000 - Use a random number table, reading three-digit numbers and ignoring values > 2000 or duplicates - Physical method: Write numbers 1-2000 on identical slips, mix thoroughly, draw 50
Identify selected items: The items corresponding to the 50 selected numbers constitute the sample.
Inspect the sample: Perform quality inspection on these 50 items.
Part (b): Selection probability
Each item has probability \(\frac{50}{2000} = 0.025 = 2.5\%\) of being selected.
(More precisely, the probability is 50/2000 using the hypergeometric distribution, but for this course, the simple ratio is the expected answer.)
Part (c): Systematic sampling (every 40th item)
No, this is NOT simple random sampling.
This is systematic sampling — a valid probability sampling method, but not SRS. The key difference:
In SRS, every possible sample of size 50 has equal probability of being selected
In systematic sampling, only 40 possible samples can be selected (determined by the starting point), and each of those has probability 1/40
Items that are exactly 40 apart will always be in the same sample or never in the same sample together
Consequence: If there’s a cyclical pattern in production (e.g., machine recalibration every 40 items), systematic sampling could produce biased results.
Part (d): Stratified selection (one per group of 40)
No, this is NOT simple random sampling.
This is a form of stratified random sampling with 50 strata (though unusual since stratum size = 40 and selecting 1 per stratum).
Guarantees exactly one item from each group of 40
Certain samples are impossible (e.g., cannot select items 1 and 2, which are in the same group)
Not all samples of size 50 have equal probability
Note: This method may actually be preferable if you want to ensure coverage across the entire production run (like blocking in experiments).
Exercise 4: Stratified Random Sampling Design
A state transportation department wants to survey 600 licensed drivers about road safety concerns. The state has three types of licensed drivers:
Urban drivers: 2,400,000 (60% of total)
Suburban drivers: 1,200,000 (30% of total)
Rural drivers: 400,000 (10% of total)
Explain why stratified sampling might be preferable to simple random sampling for this study.
Calculate the sample size for each stratum using proportional allocation.
Calculate the sample size for each stratum using equal allocation.
Discuss the trade-offs between proportional and equal allocation for this study.
Solution
Part (a): Why stratified sampling is preferable
Heterogeneous groups: Urban, suburban, and rural drivers likely have very different road safety concerns (traffic congestion vs. wildlife crossings vs. road maintenance). Treating them as one population mixes very different experiences.
Guaranteed representation: With only 600 samples and SRS, you might get very few rural drivers (expected ~60, but could be notably fewer by chance). Stratification guarantees rural voices are heard.
Subgroup comparisons: Stratification enables reliable comparisons between driver types.
Increased precision: Within each stratum, drivers are more similar, reducing within-stratum variance.
Part (b): Proportional allocation
Sample sizes proportional to population stratum sizes:
Urban: \(600 \times 0.60 = 360\) drivers
Suburban: \(600 \times 0.30 = 180\) drivers
Rural: \(600 \times 0.10 = 60\) drivers
Total: 360 + 180 + 60 = 600 ✓
Part (c): Equal allocation
Same sample size from each stratum:
Urban: \(600 / 3 = 200\) drivers
Suburban: \(600 / 3 = 200\) drivers
Rural: \(600 / 3 = 200\) drivers
Total: 200 + 200 + 200 = 600 ✓
Part (d): Trade-offs
Proportional allocation:
Advantage: Estimates for the overall population are straightforward (each driver’s response “counts” equally); mimics population structure
Disadvantage: Only 60 rural drivers — may be too few for reliable conclusions about rural-specific concerns
Equal allocation:
Advantage: 200 rural drivers allows robust analysis of rural subgroup; enables meaningful comparisons between all three groups
Disadvantage: For overall population estimates, must weight responses (urban responses count less per person, rural count more); overrepresents rural perspective in unweighted summaries
Recommendation: For this study focused on safety concerns, equal allocation is likely better because: - Policymakers want to understand each group’s concerns - Rural roads may have unique safety issues worth investigating thoroughly - 60 responses is barely adequate for meaningful subgroup analysis
Exercise 5: Sampling Frame Problems
A researcher wants to study “internet usage patterns among American adults.” Identify the sampling frame problem in each proposed approach and explain how it might bias results.
Using the phone book as a sampling frame.
Using a list of email addresses purchased from marketing companies.
Using voter registration records.
Using customer lists from internet service providers.
Solution
Part (a): Phone book as sampling frame
Problem: Severe undercoverage
Many adults (especially younger people) have only cell phones, which aren’t in phone books
Unlisted numbers excluded
Homeless individuals and those in institutional settings excluded
Those who recently moved may not be listed
Bias direction: Would overrepresent older adults, homeowners, and people with stable living situations. Internet usage patterns would likely be underestimated (older adults with landlines use internet less).
Part (b): Purchased email lists
Problem: Selection bias / undercoverage
Only captures people who signed up for services that share/sell email addresses
Excludes privacy-conscious individuals who avoid marketing lists
Excludes adults without email accounts
Quality of purchased lists is often poor (outdated, fake addresses)
Bias direction: Would overrepresent people who engage with online marketing, likely overestimating internet usage and engagement.
Part (c): Voter registration records
Problem: Undercoverage of non-voters
Excludes non-citizens, felons in some states, and adults who haven’t registered
Voter registration correlates with education, civic engagement, and age
Younger adults, lower-income adults, and recent immigrants underrepresented
Bias direction: Direction unclear — voters may be more civically engaged (potentially more internet news consumption) but also skew older (potentially less social media use).
Part (d): ISP customer lists
Problem: Fundamental selection bias
Only includes people who already have home internet service
Excludes mobile-only internet users (increasingly common, especially among younger and lower-income adults)
Excludes adults without any personal internet access
Bias direction: Would overestimate certain types of internet usage (home broadband activities) while missing patterns of mobile-only users or those who access internet only at libraries/work.
Exercise 6: Evaluating Sampling Claims
Evaluate each claim about sampling. Identify what is correct, what is incorrect, and explain.
“Our online poll received 50,000 responses, so the results must be representative of the population.”
“Simple random sampling guarantees that every demographic group will be represented in the sample.”
“Stratified random sampling always produces better estimates than simple random sampling.”
“If we randomly select participants, our sample will have no bias.”
Solution
Part (a): “50,000 responses = representative”
Incorrect.
Sample size does not determine representativeness — sampling method does. A voluntary response sample of 50,000 can be more biased than a random sample of 500.
Self-selection means respondents differ systematically from non-respondents
People with strong opinions are overrepresented
Online polls exclude those without internet access or interest in the topic
The famous 1936 Literary Digest poll had 2.4 million responses but predicted the election wrong due to biased sampling
Part (b): “SRS guarantees every demographic group represented”
Incorrect.
SRS gives every individual equal probability, but doesn’t guarantee coverage of small groups.
Small demographic groups may be completely absent by chance
Example: If a group is 1% of population and sample size is 100, there’s a reasonable probability of selecting zero members
This is why stratified sampling exists — to guarantee representation of important subgroups
Part (c): “Stratified always better than SRS”
Not always correct.
Stratified sampling offers advantages when: - Strata are internally homogeneous but differ from each other - Subgroup estimates are needed - Some subgroups might otherwise be missed
But stratified sampling may be unnecessary or worse when: - Population is already homogeneous (no natural strata) - Stratification variable is unrelated to the outcome (adds complexity without benefit) - Stratification variable is unknown before sampling - Resources for implementing stratification exceed benefits
Part (d): “Random selection = no bias”
Mostly correct, but nuanced.
Random selection eliminates selection bias in who is chosen for the sample. However:
Non-response bias can still occur if selected individuals refuse to participate
Undercoverage bias can occur if the sampling frame doesn’t cover the entire population
Measurement bias in how data is collected is unrelated to sampling method
Random selection creates unbiased selection, but the overall study can still have bias from other sources.
8.6.6. Additional Practice Problems
True/False Questions
Voluntary response sampling is a type of random sampling because participants randomly choose to respond.
In stratified random sampling, each stratum must have the same number of individuals.
Simple random sampling requires a complete list of the target population.
A larger sample size always makes a study more representative of the population.
In proportional allocation for stratified sampling, larger strata receive larger sample sizes.
Random sampling supports the assumptions needed for many statistical inference procedures.
Multiple Choice Questions
A company surveys customer satisfaction by placing a feedback form next to checkout counters. This is:
Ⓐ Simple random sampling
Ⓑ Stratified random sampling
Ⓒ Convenience sampling
Ⓓ Voluntary response sampling
Which sampling method ensures that small but important subgroups are adequately represented?
Ⓐ Simple random sampling
Ⓑ Stratified random sampling
Ⓒ Convenience sampling
Ⓓ Systematic sampling
In simple random sampling of n individuals from a population of N, the probability that any specific individual is selected is:
Ⓐ 1/N
Ⓑ n/N
Ⓒ 1/n
Ⓓ N/n
A marketing firm divides potential customers by age group and income level, then randomly samples within each category. The age-income combinations are called:
Ⓐ Clusters
Ⓑ Blocks
Ⓒ Strata
Ⓓ Treatments
Which is NOT a characteristic of random sampling methods?
Ⓐ Known selection probabilities
Ⓑ Reproducible procedures
Ⓒ Guaranteed balanced demographics
Ⓓ Quantifiable uncertainty
A researcher uses a random number generator to select students from a university roster. Before any students are contacted, 15 selected students are found to have graduated. This issue relates to:
Ⓐ Selection bias
Ⓑ Sampling frame problems
Ⓒ Response bias
Ⓓ Randomization failure
Answers to Practice Problems
True/False Answers:
False — Voluntary response is non-random because participants self-select; the probability of selection depends on motivation, not chance.
False — Strata sizes can differ, and sample sizes can be allocated proportionally, equally, or by other schemes.
True — SRS requires a sampling frame (list) from which to randomly select; without it, you cannot implement true random selection.
False — Larger biased samples just give more precise estimates of the wrong value. Sample size doesn’t fix sampling bias.
True — Proportional allocation assigns sample sizes in proportion to stratum population sizes.
True — Random sampling creates conditions (known, approximately independent selection probabilities) that support the assumptions underlying inference procedures, especially when the sampling fraction is small.
Multiple Choice Answers:
Ⓓ — Voluntary response: customers choose whether to pick up and complete the form.
Ⓑ — Stratified sampling can guarantee minimum sample sizes for each stratum/subgroup.
Ⓑ — Each individual has probability n/N of being in a random sample of size n from population N.
Ⓒ — In stratified sampling, the subgroups are called strata.
Ⓒ — Random sampling doesn’t guarantee balanced demographics; it gives each person equal probability, but small groups may be missed by chance.
Ⓑ — The sampling frame (roster) was outdated, not matching the current population. This is a coverage/frame problem.