Slides 📊
8.5. Examples of Experimental Design
The examples we will explore in this section demonstrate how researchers identify key features of their research context, match those features to appropriate design frameworks, and implement the designs while addressing practical constraints. Each example builds on the principles and design types we have studied, showing how they work together in realistic research scenarios.
8.5.1. Example 1: Instructional Methods Study
Educational researchers want to understand how different instructional methods affect student learning outcomes. The researchers identify three instructional approaches they want to compare:
Self-study from textbook: Students learn independently using written materials
Traditional classroom instruction: Students attend lectures and participate in class discussions
Online instruction: Students complete computer-based modules with interactive content
They recruit a sample of 90 students who will all be learning the same material. The students are randomly assigned to the three groups, with 30 students in each group. After a specified learning period, all students take the same comprehensive exam, and the researchers compare average scores across the three instructional methods.
Design Analysis
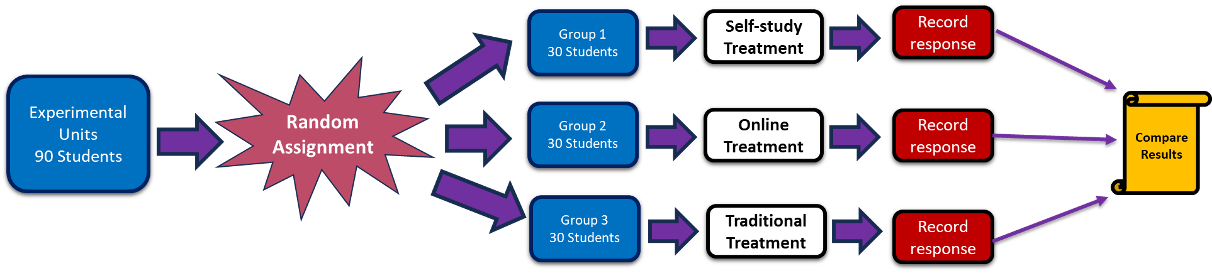
Fig. 8.8 Example 1: Instructional Methods
1. What type of experimental design is used?
This is a Completely Randomized Design (CRD). The key evidence is that students are simply randomly assigned to one of the three treatment groups without any prior grouping or blocking. No student characteristics are used to form blocks, and there’s no pairing or matching process.
2. What are the experimental units?
The 90 students serve as the experimental units. Since we’re dealing with human participants, they are more specifically called subjects.
3. What are the factors and their levels?
There is one factor: the type of instructional method. Its three levels are
Self-study from textbook
Traditional classroom instruction
Online instruction
Note that the traditional classroom instruction could be considered a control group since it represents the standard or conventional approach against which the other methods are being compared.
4. What is the response variable?
The response variable is the final exam score. This provides a quantitative measure of how well students learned the material under each instructional approach.
8.5.2. Example 2: Hand Cream Comparison
A cosmetics company wants to compare the effectiveness of two different hand cream formulations. Consumer satisfaction is highly subjective and varies greatly between individuals based on skin type, preferences, and expectations. This variability makes it difficult to detect treatment differences using simple comparisons.
The researchers recruit 40 women to participate in a hand cream comparison study. Half the women (20) use Hand Cream Type 1 for one month, while the other half (20) use Hand Cream Type 2 for one month. All participants stop using any hand cream for two weeks to allow the effects of the first cream to dissipate. The groups switch—those who used Type 1 now use Type 2 for one month, and those who used Type 2 now use Type 1 for one month. At the end of each phase, participants complete satisfaction surveys. The researchers then compare each participant’s satisfaction with Type 1 versus Type 2.
Design Analysis
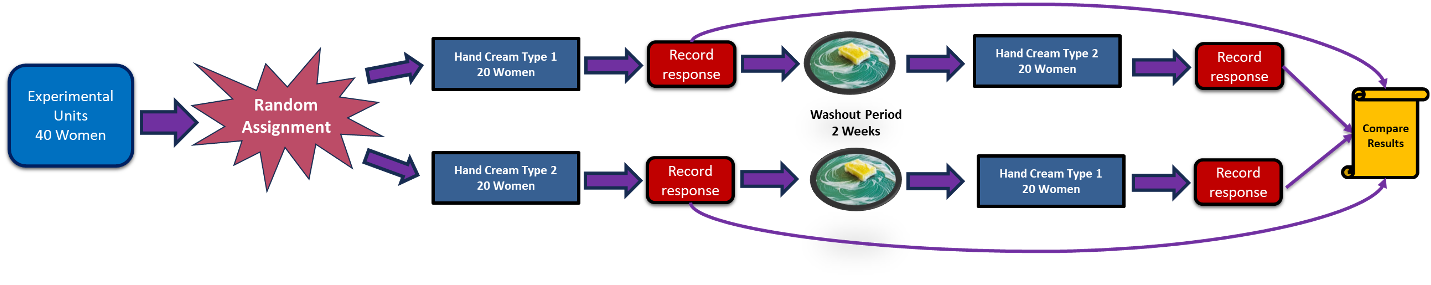
Fig. 8.9 Example 2: Hand Cream Comparison
1. What type of experimental design is used?
This is a Matched Pairs Design, Type 2 (also called a self-paired design). The key identifying feature is that each participant serves as her own control by trying both treatments.
2. What are the experimental units?
The 40 women are the experimental units.
3. What are the factors and their levels?
There is one factor: the application of the two different hand cream formulations. Its levels are
Application of Hand Cream Type 1
Application of Hand Cream Type 2
4. What is the response variable?
The response variable is the satisfaction score. This is likely measured through a standardized survey that produces a numerical score representing each participant’s satisfaction with the hand cream they used during each phase.
8.5.3. Example 3: Dairy Cow Nutrition Study
Agricultural researchers want to investigate whether the type of grain mix affects milk production in dairy cows. The researchers plan to compare two different brands of grain mix to see which produces higher milk yields. They have access to 16 dairy cows from different farms, but these cows represent four different breeds. The breed of cow is known to significantly affect baseline milk production, with some breeds naturally producing much more milk than others.
The 16 cows are first separated into four blocks based on their breed, with 4 cows from each breed in each block. Within each breed (block), 2 cows are randomly assigned to receive Grain Mix Brand 1, and the other 2 cows receive Grain Mix Brand 2. After a specified feeding period, milk production is measured for each cow, and the researchers compare average production between the two grain mix brands while accounting for breed differences.
Design Analysis
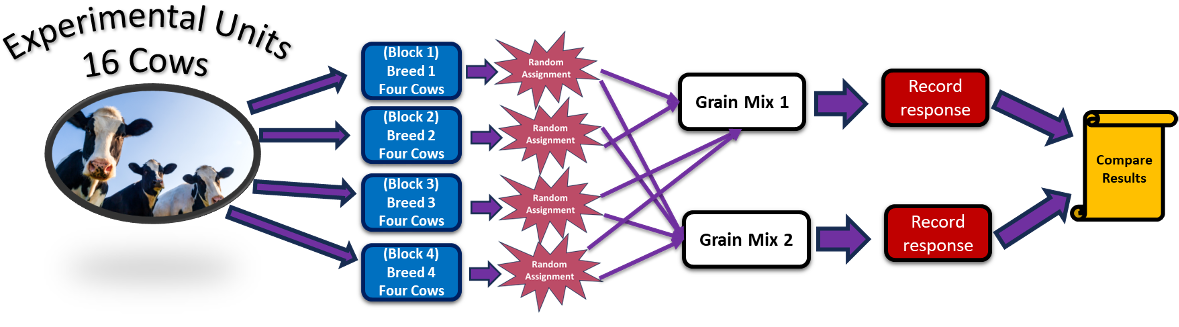
Fig. 8.10 Example 3: Dairy Cow Nutrition Study
1. What type of experimental design is used?
This is a Randomized Block Design (RBD). The key identifying features are:
Experimental units are first grouped into blocks based on an important characteristic (breed).
Random assignment occurs within each block rather than across all units.
The blocking variable (breed) is not the primary interest but is controlled to improve precision.
2. What are the experimental units?
The 16 dairy cows serve as the experimental units.
3. What are the factors and their levels?
The factor of interest is the type of grain mix. This has two levels: Brand 1 and Brand 2.
4. What is the response variable?
The response variable is milk production, likely measured as the total volume of milk produced per cow over a specified time period (such as gallons per day or pounds per week).
8.5.4. Bringing It All Together
8.5.5. Exercises
These exercises develop your ability to analyze experimental designs by identifying components, recognizing design types, and applying principles from previous sections.
Key Concepts
Design Analysis Framework
For any experiment, identify:
Design type: CRD, RBD, or Matched Pairs (Type 1 or 2)
Experimental units: Objects to which treatments are applied
Factors and levels: Variables being studied and their settings
Treatments: Specific combinations of factor levels
Response variable: Outcome being measured
Control group: Baseline comparison (if present)
Blocking variable: Characteristic used for grouping in RBD
Design Indicators
CRD: Simple random assignment, no grouping mentioned
RBD: “Grouped by…”, “blocks based on…”, “within each…”
Matched Pairs Type 1: “Pairs of similar…”, “identical twins”
Matched Pairs Type 2: “Each participant received both…”, “crossover”, “washout period”
Key Reminder: A blocking variable is chosen because it affects the response, not because it is “interesting.” The goal is to remove nuisance variation, not to study the blocking variable itself.
Exercise 1: Design Analysis — Battery Life Study
A smartphone manufacturer wants to compare battery life under three different usage patterns: light use (browsing, messaging), moderate use (streaming, gaming 1hr/day), and heavy use (gaming, video calls). They obtain 60 phones of the same model and randomly assign 20 phones to each usage pattern. Phones are run through standardized daily usage simulations, and battery life (hours until 10% charge) is recorded.
Analyze this experiment by identifying:
The experimental design type
The experimental units
The factor(s) and level(s)
The treatments
The response variable
Whether a control group is present
How each of the three principles (Control, Randomization, Replication) is addressed
Solution
Part (a): Design type
Completely Randomized Design (CRD)
Phones are simply randomly assigned to usage patterns with no blocking or pairing.
Part (b): Experimental units
The 60 smartphones of the same model.
Part (c): Factor(s) and level(s)
Factor: Usage pattern (1 factor)
Levels: Light, Moderate, Heavy (3 levels)
Part (d): Treatments
The three treatments are the three usage patterns: Light use, Moderate use, Heavy use.
Part (e): Response variable
Battery life — hours until battery reaches 10% charge.
Part (f): Control group
Light use serves as the baseline condition against which more intensive usage patterns are compared. Note: This is a “reference condition” rather than a traditional “no treatment” control group — all three conditions involve active phone usage.
Part (g): Three principles
Control: Standardized daily usage simulations ensure consistent testing conditions; same phone model eliminates device variation; same threshold (10% charge) provides consistent measurement endpoint.
Randomization: Random assignment of phones to usage patterns prevents systematic bias (e.g., avoiding accidentally assigning phones from the same manufacturing batch to the same group).
Replication: 20 phones per treatment group provides substantial replication to distinguish usage effects from phone-to-phone variation.
Exercise 2: Design Analysis — Pain Management Study
Researchers compare the effectiveness of two post-surgical pain management approaches: traditional medication alone vs. medication plus physical therapy. The study includes 80 patients undergoing knee replacement surgery. Patients are first classified by age group (under 60, 60 and over), then within each age group, they are randomly assigned to one of the two approaches. Pain levels are assessed using a standardized scale 4 weeks post-surgery.
Analyze this experiment by identifying:
The experimental design type
The experimental units
The factor(s) and level(s)
The treatments
The response variable
The blocking variable and why it was chosen
The control group (if any)
Solution
Part (a): Design type
Randomized Block Design (RBD)
Patients are grouped into blocks by age before random assignment within blocks.
Part (b): Experimental units
The 80 patients undergoing knee replacement surgery.
Part (c): Factor(s) and level(s)
Factor: Pain management approach (1 factor)
Levels: Medication alone, Medication plus physical therapy (2 levels)
Part (d): Treatments
Two treatments:
Traditional medication alone
Medication plus physical therapy
Part (e): Response variable
Pain level — measured on a standardized pain scale at 4 weeks post-surgery.
Part (f): Blocking variable
Blocking variable: Age group (under 60, 60 and over)
Rationale: Age affects recovery from surgery, pain perception, mobility, and response to physical therapy. Older patients may heal more slowly and experience more pain regardless of treatment. Blocking ensures each treatment is tested on both younger and older patients, removing age-related variation from the treatment comparison.
Part (g): Control group
Medication alone serves as the control group — it represents the current standard of care (status quo) against which the enhanced approach (adding physical therapy) is compared.
Exercise 3: Design Analysis — Keyboard Ergonomics Study
An office equipment company tests two keyboard designs (curved vs. flat) for their effect on typing comfort. They recruit 30 office workers. Each worker uses the curved keyboard for one week, has a weekend break, then uses the flat keyboard for one week (with the order randomized for each participant). At the end of each week, workers rate their comfort on a 1-10 scale.
Analyze this experiment by identifying:
The experimental design type
The experimental units
The factor(s) and level(s)
The treatments
The response variable
How carry-over effects are addressed
Why randomizing order is important
Solution
Part (a): Design type
Matched Pairs Design — Type 2 (Self-pairing/Crossover)
Each worker serves as their own control by using both keyboards.
Part (b): Experimental units
The 30 office workers (subjects).
Part (c): Factor(s) and level(s)
Factor: Keyboard design (1 factor)
Levels: Curved, Flat (2 levels)
Part (d): Treatments
Two treatments:
Using the curved keyboard
Using the flat keyboard
Part (e): Response variable
Comfort rating — a 1-10 scale score reported at the end of each week.
Part (f): Addressing carry-over effects
Weekend break serves as a washout period between keyboards
Allows any physical adaptation (muscle memory, hand positioning) to dissipate before trying the second keyboard
A weekend (2 days) is a minimal washout; a longer washout may be preferable if physical adaptation is substantial
For keyboard ergonomics, weekend washout is likely adequate since effects are primarily immediate physical sensations rather than lasting physiological changes
Part (g): Importance of randomized order
Controls for time effects: Workers may become more comfortable with typing over time regardless of keyboard (practice effect) or may develop fatigue (decline over time)
Controls for expectation bias: If all workers tried curved first, any observed preference might reflect novelty rather than true keyboard superiority
Balances asymmetric adaptation: If switching from one type to another causes temporary discomfort, randomization ensures both keyboards equally experience being “second”
Exercise 4: Design Analysis — Agricultural Yield Study
Agronomists compare three irrigation methods (drip, sprinkler, flood) for corn yield. They have access to a research farm with 36 plots arranged in a grid. The plots vary in soil drainage from east (well-drained) to west (poorly-drained). Researchers divide the farm into 6 drainage zones (blocks) of 6 plots each. Within each zone, 2 plots are randomly assigned to each irrigation method. Corn yield (bushels per acre) is measured at harvest.
Analyze this experiment by identifying:
The experimental design type
The experimental units
The factor(s), level(s), and treatments
The response variable
The blocking variable and number of blocks
How many plots receive each treatment within each block?
Why blocking by drainage is important for this study
Solution
Part (a): Design type
Randomized Block Design (RBD)
Plots are grouped by drainage zone before random assignment within blocks.
Part (b): Experimental units
The 36 agricultural plots.
Part (c): Factor(s), level(s), and treatments
Factor: Irrigation method (1 factor)
Levels: Drip, Sprinkler, Flood (3 levels)
Treatments: The 3 irrigation methods are the 3 treatments
Part (d): Response variable
Corn yield — measured in bushels per acre.
Part (e): Blocking variable and number of blocks
Blocking variable: Drainage zone (based on soil drainage quality)
Number of blocks: 6 drainage zones
Part (f): Plots per treatment per block
2 plots per treatment within each block.
6 blocks × 2 plots/treatment/block = 12 plots per treatment overall
Each block: 3 treatments × 2 plots = 6 plots
Part (g): Why blocking by drainage is important
Drainage directly affects crop growth: Well-drained soil prevents waterlogging; poorly-drained soil may cause root problems
Irrigation interacts with drainage: Flood irrigation on poorly-drained soil may cause flooding, while drip irrigation may be especially effective on well-drained soil
Removing drainage variation: By blocking, we compare irrigation methods on plots with similar drainage. Any effect of drainage is accounted for within blocks, making irrigation comparisons more precise
Spatial structure: The east-west drainage gradient means simple randomization might accidentally assign all drip plots to one end of the farm
Exercise 5: Design from Description
Read each description and determine: (1) the design type, (2) the number of treatments, and (3) whether a control group exists.
“Fifty patients with chronic back pain are randomly assigned to receive either a new pain medication, an established medication, or a placebo. Pain levels are measured weekly for 8 weeks.”
“Researchers test whether font color affects reading speed. Each of 25 participants reads passages in black text, blue text, and red text, with the order randomized for each participant.”
“A factory tests three assembly line configurations. Lines are first grouped by worker experience level (high, medium, low). Within each experience group, each configuration is randomly assigned to one assembly line. Production output is measured over a month.”
“Identical twins are recruited to study exercise effects. In each twin pair, one is randomly assigned to a structured exercise program while the other maintains their usual routine. Fitness is measured after 12 weeks.”
Solution
Part (a):
Design: Completely Randomized Design (CRD)
Number of treatments: 3 (new medication, established medication, placebo)
Control group: Yes — the placebo group serves as the control
Part (b):
Design: Matched Pairs Type 2 (Self-pairing)
Number of treatments: 3 (black, blue, red text)
Control group: Black text could be considered control (standard), though all three are active conditions being compared
Note: Although there are 3 treatments, this is still self-pairing because each participant experiences all conditions. The analysis compares within-person differences.
Part (c):
Design: Randomized Block Design (RBD)
Number of treatments: 3 (three configurations)
Control group: None explicitly mentioned; all three are active configurations being compared
Part (d):
Design: Matched Pairs Type 1 (Separate units in pairs)
Number of treatments: 2 (exercise program vs. usual routine)
Control group: Yes — the twin maintaining “usual routine” serves as the control
Exercise 6: Design Modification
The following study uses a Completely Randomized Design. Propose how it could be modified to use a Randomized Block Design, and explain the advantages of the modification.
“A pharmaceutical company tests four doses of a new cholesterol medication (10mg, 25mg, 50mg, 100mg) plus a placebo on 200 patients. Patients are randomly assigned to one of the five groups (40 per group). Cholesterol reduction is measured after 6 months.”
Identify two potential blocking variables for this study.
Describe how the study would be implemented as an RBD using one of your blocking variables.
What advantages would the RBD offer over the CRD in this context?
Are there any disadvantages to using RBD here?
Solution
Part (a): Potential blocking variables
Baseline cholesterol level: Patients with very high cholesterol may respond differently (more or less dramatically) to medication than those with moderately elevated cholesterol. Could block into categories like “high” (>240 mg/dL) and “very high” (>280 mg/dL).
Age group: Older patients may have different medication metabolism and response patterns. Could block by age (e.g., under 50, 50-65, over 65).
Presence of other cardiovascular conditions: Patients with existing heart disease may respond differently. Could block by risk profile.
Body mass index (BMI): Medication dosing and effectiveness often relates to body size.
Part (b): RBD implementation using baseline cholesterol
Form blocks: Classify 200 patients into baseline cholesterol categories: - Block 1: Moderately elevated (200-239 mg/dL) — say, 80 patients - Block 2: High (240-279 mg/dL) — say, 80 patients - Block 3: Very high (≥280 mg/dL) — say, 40 patients
Randomize within blocks: Within each block, randomly assign patients to the 5 treatment groups in proportion to block size. - Block 1: 16 patients per dose group - Block 2: 16 patients per dose group - Block 3: 8 patients per dose group
Analyze: Compare treatments within blocks, then combine results to estimate overall treatment effects while accounting for baseline cholesterol differences.
Part (c): Advantages of RBD
Increased precision: Baseline cholesterol strongly predicts treatment response. By blocking, we remove this source of variation from treatment comparisons.
Guaranteed representation: Ensures each dose is tested across all baseline severity levels, preventing chance imbalances.
Subgroup insights: Can examine whether optimal dose differs by baseline severity.
Smaller standard errors: More precise estimates may allow for detecting smaller but clinically meaningful dose differences.
Part (d): Disadvantages of RBD
Increased complexity: Requires measuring baseline cholesterol before randomization and implementing stratified randomization.
Block size constraints: If blocks are small, may not have equal numbers per treatment within each block.
Analysis complexity: Statistical analysis must account for block structure.
Pre-specification required: Blocking variable must be identified and measured before the study begins; cannot add blocks retrospectively.
Exercise 7: Complete Design Specification
Design a complete experiment to test whether different room temperatures affect cognitive performance on standardized tests.
You have access to: - 60 college student volunteers - Three temperature conditions: Cool (65°F), Comfortable (72°F), Warm (80°F) - Rooms that can be set to specific temperatures - Standardized cognitive tests with multiple equivalent versions
Propose two different experimental designs (choosing from CRD, RBD, or Matched Pairs), and for each:
Describe the implementation procedure
Identify the experimental components (units, factors, levels, response)
Explain how the three principles are addressed
Discuss advantages and disadvantages
Solution
Design 1: Completely Randomized Design (CRD)
(a) Implementation:
Randomly assign each of 60 students to one of 3 temperature conditions (20 per condition)
Students complete a standardized cognitive test in a room set to their assigned temperature
Record test scores for all students
(b) Components:
Experimental units: 60 students
Factor: Room temperature
Levels: Cool (65°F), Comfortable (72°F), Warm (80°F)
Response: Cognitive test score
(c) Three principles:
Control: “Comfortable” (72°F) serves as control (typical room temperature); standardized test and room conditions across groups
Randomization: Random assignment to temperatures
Replication: 20 students per condition
(d) Advantages/Disadvantages:
Advantage: Simple implementation; each student only takes one test (no practice effects)
Disadvantage: Individual differences in baseline cognitive ability create variability; may need larger sample to detect temperature effects
—
Design 2: Matched Pairs Type 2 (Self-pairing/Crossover)
(a) Implementation:
Each student completes three test sessions (one at each temperature) over three different days
Order of temperatures is randomized for each student
Use three equivalent test versions to prevent practice effects from repeated testing
Allow at least one day between sessions for washout of any temperature adaptation
Record test scores for each student at each temperature
(b) Components:
Experimental units: 60 students (each measured 3 times)
Factor: Room temperature
Levels: Cool, Comfortable, Warm
Response: Cognitive test score
(c) Three principles:
Control: Each student serves as own control; “Comfortable” as reference condition
Randomization: Order of temperatures randomized per student; test version assigned randomly
Replication: 60 observations per temperature condition
(d) Advantages/Disadvantages:
Advantage: Eliminates individual differences; very high statistical power; requires fewer total students
Disadvantage: Three sessions per student (logistically complex, dropout risk); requires truly equivalent test versions; potential practice/fatigue effects across sessions despite different versions
—
Recommendation: If test versions are truly equivalent and dropout is unlikely, Design 2 (Crossover) offers much higher power. If students can only participate once or equivalent test versions are questionable, Design 1 (CRD) is simpler and still viable with 60 students.
8.5.6. Additional Practice Problems
Matching: Match each scenario to the most appropriate design.
Scenario |
Design |
|---|---|
|
|
|
|
|
|
|
|
Multiple Choice Questions
A study compares three teaching methods using students from four different schools. Students within each school are randomly assigned to methods. This is:
Ⓐ CRD with 3 treatments
Ⓑ RBD with schools as blocks
Ⓒ Matched Pairs with schools as pairs
Ⓓ CRD with 12 treatments
Which component identifies a Matched Pairs Type 2 design?
Ⓐ Two treatments compared using pairs of similar subjects
Ⓑ Random assignment of individuals to groups
Ⓒ Each subject receives all treatments in randomized order
Ⓓ Subjects grouped by a blocking variable
In an RBD comparing 4 fertilizers across 5 soil types with 3 plots per treatment per block, how many total experimental units are there?
Ⓐ 12
Ⓑ 20
Ⓒ 60
Ⓓ 100
A crossover study includes a “washout period” primarily to:
Ⓐ Allow researchers time to prepare the next treatment
Ⓑ Prevent carry-over effects from the first treatment
Ⓒ Increase the sample size
Ⓓ Blind participants to their treatment assignment
Answers to Practice Problems
Matching Answers:
B (RBD) — Plots divided by soil type (blocking variable), then random assignment within each soil type.
D (Matched Pairs Type 2) — Each participant experiences both conditions (self-pairing).
A (CRD) — Simple random assignment with no blocking or pairing mentioned.
C (Matched Pairs Type 1) — Natural pairs (twins) with one member assigned to each treatment.
Multiple Choice Answers:
Ⓑ — Schools serve as blocks; random assignment occurs within each school block.
Ⓒ — Type 2 (self-pairing/crossover) is defined by each subject receiving all treatments.
Ⓒ — 4 fertilizers × 5 blocks × 3 plots per treatment per block = 60 plots total.
Ⓑ — The washout period allows the first treatment’s effects to dissipate before the second treatment begins.