Welcome to the fascinating world of statistics! Statistics surrounds us daily—from weather forecasts and
medical studies to economic reports and political polls. As we begin our journey together this semester,
let’s explore some fundamental questions: what exactly is statistics, and what powers its universal presence?
Statistics is a framework for making sense of the real world through data and drawing meaningful conclusions
in the face of uncertainty. The American Statistical Association defines statistics as
“the science of learning from data and of measuring, controlling, and communicating uncertainty.”
In the remainder of this section, we will learn how this definition correctly entails the field of statistics by
examining its major branches and understanding the role of a statistician in making statistics available for
broad audience.
Road Map 🧭
Define the four branches of statistics, and understand how they interact.
Understand the role of a statistician.
Understand what it means to achieve the three stages of statistical competence. Understand
where we are now and where we will be at the end of this course.
Statistics is a diverse ecosystem of interconnected components. One way to view statistics is
to divide it into four branches: data management, exploratory data analysis, inferential statistics,
and predictive analytics.
A. Data Management: Collection, Cleaning, and Storage
A data-collecting process begins with careful planning. This entails
defining clear objectives for what you want to achieve with the data,
determining the specific questions that need to be answered through the data,
developing a detailed plan including timelines, resources needed,
roles and responsibilities, and the data types to be recorded.
planning for potential challenges and how to address them, and
continuously reviewing the data collection process.
Ethical considerations must also be factored in, especially when
the procedure involves human participants. It is important to comply with relevant laws and
regulations (e.g., FERPA, HIPAA, GDPR), obtain informed consent from all participants, and
ensure privacy and confidentiality.
Some widely used collection methods include surveys and questionnaires, interviews, observations,
experiments, web scraping, sensor-based and electronic data collection, and document and record reviews.
This stage consists of an overall inspection and organization of collected datasets.
Some possible issues addressed during this stage are:
Correction of errors such as duplicate entries
Consolidating data from various sources
Resolving conflicts in data types, values, and formats
Handling missing data. Different strategy may be chosen depending on the nature of the missing entry.
Some possibilities are deletion, imputation (making an educated guess),
and flagging (not taking an immediate action other than making a note).
Data cleaning is often a repeated process, especially when new data is collected periodically. It is
advisable to maintain comprehensive documentation of the data cleaning steps.
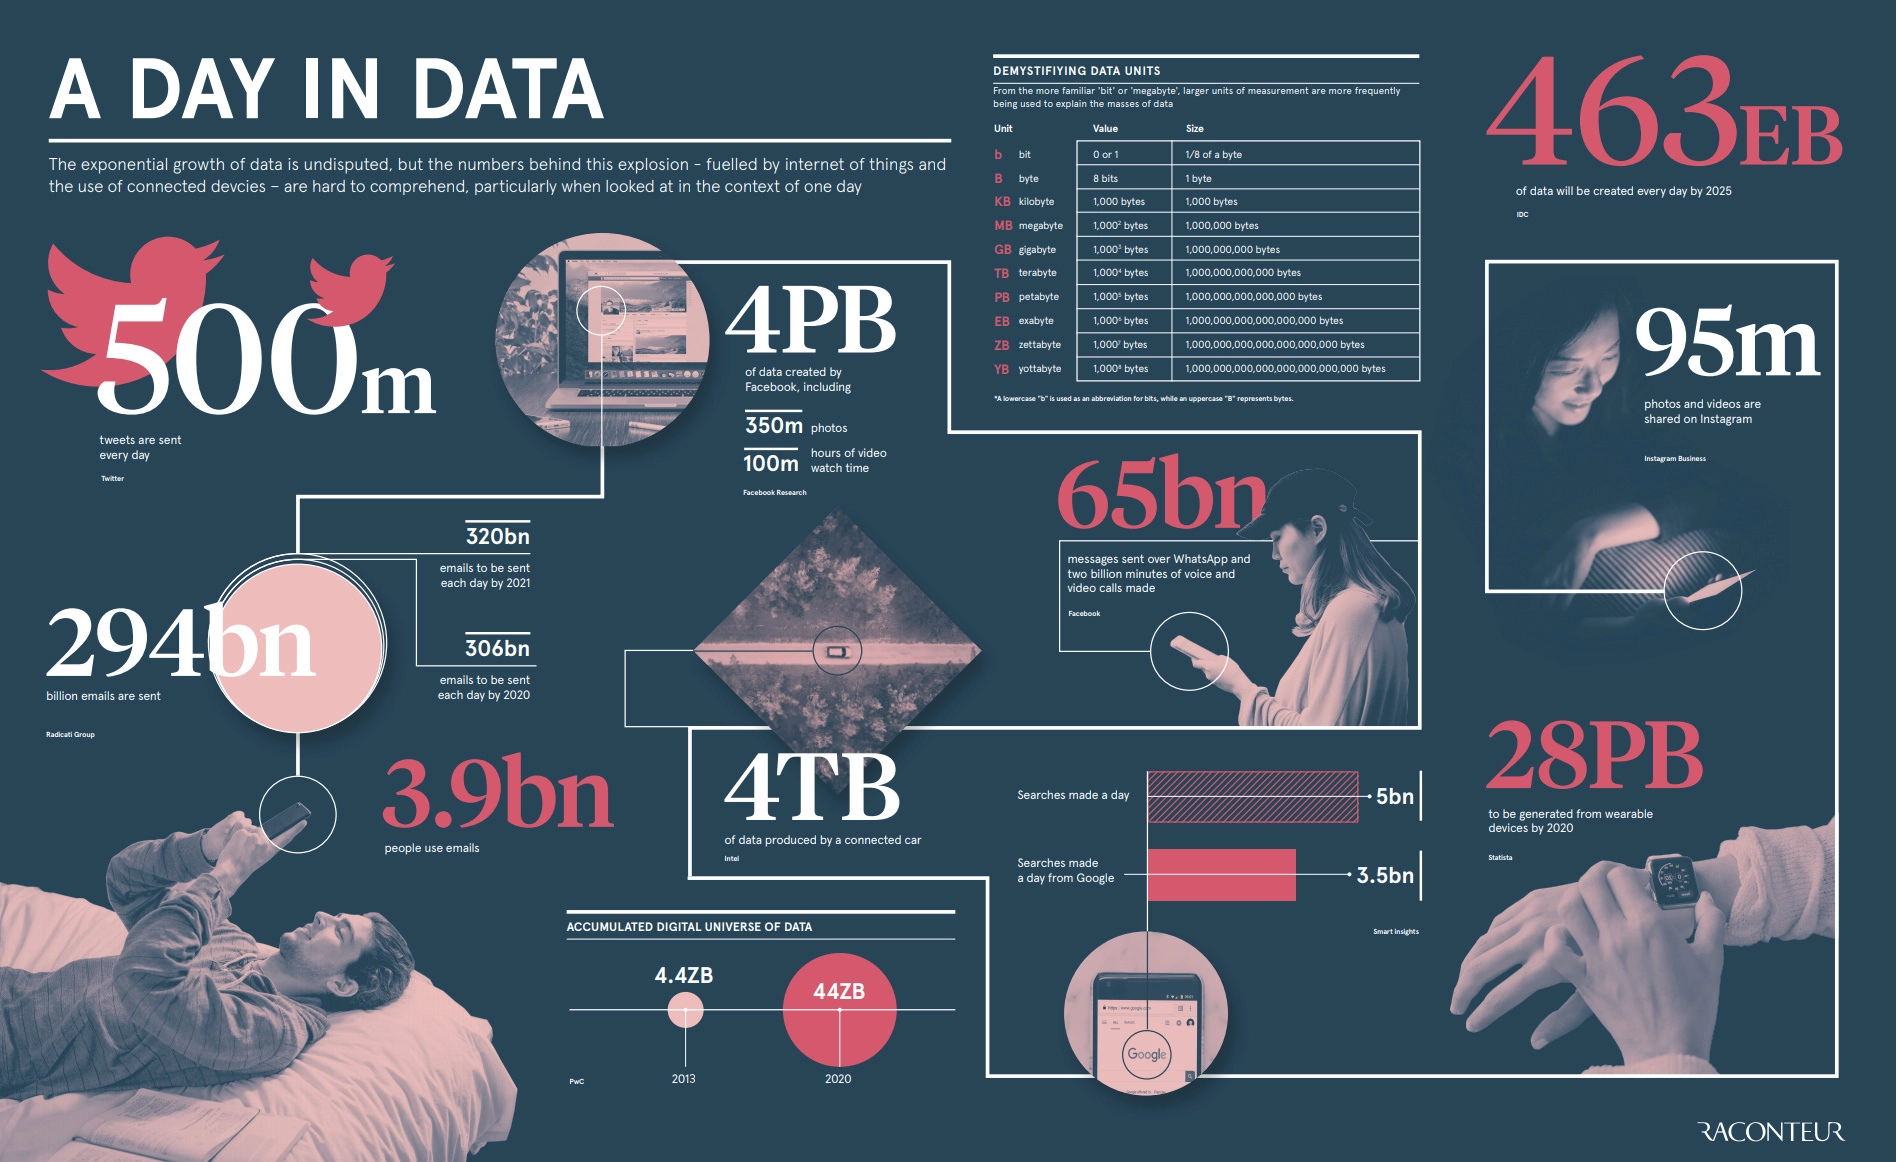
We live in an era of unprecedented data abundance.
Social media platforms generate billions of interactions daily.
Location services track geographical movements of people and vehicles.
Wearable devices monitor health metrics around the clock.
Business transactions create detailed records of economic activity.
By 2025, experts predict approximately 463 exabytes of data will exist globally—a volume almost
impossible to conceptualize (one exabyte equals one billion gigabytes). This explosion of data
creates both opportunities and challenges for statisticians.
In this course, we’ll focus primarily on structured data in manageable volumes, building foundational
skills to master essential principles that remain relevant regardless of data scale or format.
When data is large or has a complex structure, an efficient storage solution must be implemented by
establishing appropriate data schemas. When a dataset consists of multiple parts, it should be
cataloged or integrated into a unified, condensed form. Various storage solutions exist for such
datasets, including relational databases, data warehouses, data lakes, and cloud storage.
Once the data is stored, accessing and retrieving it also requires careful planning due to factors
such as volume, privacy constraints, or regulatory sensitivity. It may be necessary to develop
efficient querying mechanisms using SQL, utilize APIs, implement robust user access controls, apply
encryption, and more.
Connection to future chapters
Good practices in data collection will be discussed in Chapter 8. Most Computer Assignments
will require various steps of data cleaning to suit the questions being addressed.
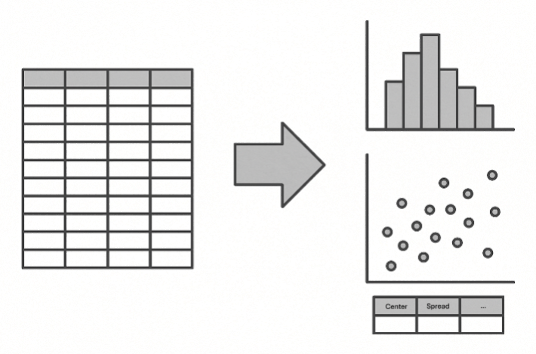
Once we have collected and prepared our data, our first task is to perform
Exploratory Data Analysis (EDA). During EDA, key features of the data are visually and
numerically summarized through descriptive statistics. Descriptive statistics reveal
patterns and detect peculiarities in the dataset.
EDA is typically an iterative process—we examine the data, formulate questions, explore further, refine
our understanding, and repeat. This cycle helps us develop hypotheses and determine which inferential methods might
be most appropriate for deeper analysis.
Connection to future chapters
Descriptive statistics are introduced in Chapters 2 and 3. The techniques learned here will serve as
assisting tools in Chapters 7-13.
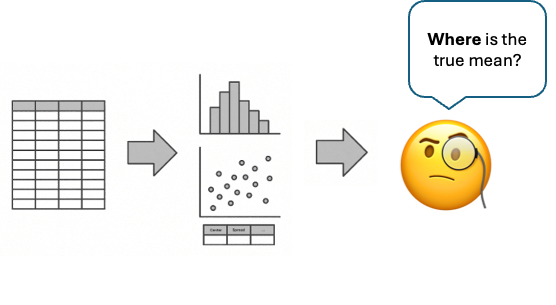
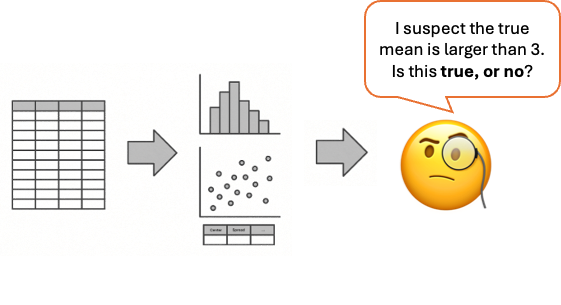
Perhaps the most powerful branch of statistics, inferential statistics allows us to extend what we learn from samples
to conclusions about entire populations. Two major branches of statistical inference are:
Parameter estimation involves making informed guesses about a key value of the population, such as the mean, median, or variance.
This can be done through
Point estimation: finding a single “best guess” for the unknown value
Interval estimation: constructing a range to which the unknown value is expected to belong
Regardless of the branch, statistical inference always involves the following key elements.
Assumption validation: Most inference methods are constructed under a set of assumptions
about the data-generating population. They must be verified for each dataset to ensure
reliability of the inference results.
Uncertainty quantification: The core of statistical inference is the ability to
draw conclusions in the face of uncertainty and to numerically express the degree of confidence
in the result.
Connection to future chapters
Foundations of parameter estimation and hypothesis testing will be covered in Chapters 9 and 10,
respectively. Both will remain relevant for various inference scenarios in Chapters 11-13.
Rather than understanding current data, predictive analytics focuses on what might happen next.
Predictive analytics often requires large datasets as it relies on patterns and
relationships identified in historical data to predict future events.
Key elements of predictive analytics are:
Modeling of variable relationships: Structuralize the relationship between two or more
variables. Use this structure as a tool for making predictions. This model can be as simple as
a linear pattern, or as complex as a deep neural network.
Prediction: Make educated guesses on unobserved values based on the identified model
and the individual’s observed characteristics.
Connection to future chapters
We’ll touch on predictive methods primarily through linear regression, in Chapter 13.
1.1.2. Course Goals: Growing as a Competent Statistician
Having explored what statistics is, let’s consider who practices it. The American Statistical Association
defines a statistician as
“a person who applies statistical thinking and methods to a wide variety of scientific, social,
and business endeavors.”
This broad definition encompasses professionals working across diverse fields—astronomy, biology,
education, economics, engineering, genetics, and many others.
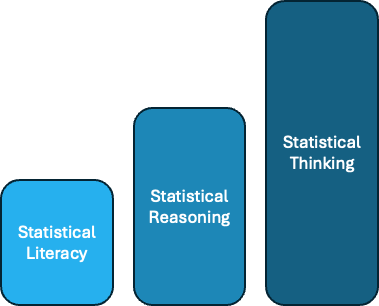
This course aims to develop your statistical abilities across three progressively sophisticated levels:
At the most fundamental level, statistical literacy includes:
Understanding basic data management principles
Exploring data effectively through visual and numerical methods
Comprehending the vocabulary and notation statisticians use
Grasping how probability serves as the framework for measuring uncertainty
Recognizing when particular statistical methods are appropriate
Statistical literacy allows you to read and understand statistical information—the minimum required
to be an informed consumer of research and data-based claims.
The most sophisticated level, statistical thinking encompasses:
Understanding how statistical models represent and simulate real-world phenomena
Selecting appropriate inferential tools for specific analytical situations
Seeing the entire pipeline from data collection through analysis to interpretation
Being able to design studies and experiments.
Statistical thinking represents the mindset of a practitioner who can navigate
the entire statistical process independently.
While developing complete statistical thinking extends beyond a single course, by semester’s end,
you should achieve statistical literacy and begin developing reasoning skills. These capabilities
will serve you well regardless of your career path, enhancing your ability to make decisions in our
data-rich world.