Slides 📊
8.7. Sampling Bias
Sampling bias represents a systematic error that occurs during the sampling process and reduces the representativeness of the resulting data. Knowing its sources and developing strategies to minimize its impact is essential for conducting reliable research and interpreting research findings appropriately.
Road Map 🧭
Understand that bias can arise in both non-random and random sampling procedures.
Recognize the different types of sampling bias.
Understand the difference between bias and variability.
Be aware that it is impossible to design a perfect study. Take measures to minimize any flaws that can be controlled, and be honest about those that cannot be removed in your interpretations.
8.7.1. Understanding Sampling Bias: The Systematic Threat to Validity
Sampling bias is the result of obtaining a sample in which certain units or subjects are systematically favored over other members of the population. Unlike random sampling variation, which produces unpredictable differences between samples and can be reduced through larger sample sizes, bias creates consistent distortions that persist regardless of sample size.
Non-Random Sampling Guarantees Bias
Non-random sampling techniques create systematic bias by their very nature.
Convenience sampling systematically favors participants who are easy to access.
Self-selection overrepresents the group of people who have specific motivations to participate.
Bias Can Still Occur in Random Samples
Undercoverage bias results from failing to include all members of the target population in the sampling frame. This can occur even in randomized studies when certain subgroups are systematically excluded.
Non-response bias occurs when selected participants fail to participate in the study, drop out before completion, or fail to complete portions of the study. This differs from undercoverage bias because these individuals were initially included in the sample but chose not to participate or couldn’t complete their participation.
Response bias occurs when participants provide answers that do not accurately reflect their true beliefs, behaviors, or characteristics. This may happen because
Participants answer questions in ways they think are socially desirable.
Participants do not recall past events accurately.
The questions are poorly worded or suggests preferred answers.
8.7.2. Recognizing Bias in Practice
Example 1: Michigan Lead Poisoning Study
A childhood lead poisoning prevention council in Michigan undertook responsibility for determining the proportion of homes in their state with unsafe lead levels. Michigan was divided into municipalities, and homes were sampled from each municipality for a total of 5,000 homes. However, several municipalities were not visited due to high crime rates, and 73 homes were unable to be tested due to resident refusal.
Sampling Methodology Analysis
This study used stratified random sampling with municipalities as strata. The researchers recognized that different municipalities would likely have different characteristics affecting lead levels:
Older municipalities might have more homes with lead paint.
Urban areas might have different housing stock than rural areas.
Socioeconomic differences between municipalities might correlate with housing quality and maintenance.
Stratifying by municipality was a sound approach that could improve the precision of estimates while ensuring representation across different types of communities. Despite the solid sampling design, this study suffered from multiple types of bias.
Undercoverage Bias: The systematic exclusion of high-crime municipalities created undercoverage bias. This exclusion was particularly problematic because:
High-crime areas often correlate with poverty and older housing stock.
Lead poisoning risk is typically higher in low-income areas with older homes.
The very communities most at risk for lead exposure were systematically excluded.
Non-Response Bias: The 73 homes that refused testing created non-response bias. The reasons for refusal might correlate with lead levels.
Residents who suspect lead problems might refuse testing to avoid property value impacts.
Landlords might refuse testing to avoid legal obligations for remediation.
Residents with positive previous experiences with government might be more willing to participate.
Implications: The combination of these biases means the study likely underestimated lead problems in Michigan homes. Policymakers using these results would have an incomplete picture of the public health risk, potentially leading to inadequate resource allocation for lead remediation programs.
Example 2: Purdue Honor Pledge Study
The Honor Pledge Task Force (HPTF) at Purdue decided to gather data on the success of the honor pledge program. They randomly selected a sample of 132 students from the database of students who had voluntarily taken the pledge. Students were contacted via email and asked to answer questions regarding any violations of the pledge.
Sampling Methodology Analysis
This study used simple random sampling (SRS). The use of random selection from a complete database was methodologically sound within the constraints of the defined population.
However, the population was restricted to students who had voluntarily taken the pledge. This means any conclusions can only apply to pledge-taking students, not to all Purdue students. This limitation doesn’t represent bias per se, but it does limit the generalizability of results. This study also faced several sources of bias.
Response Bias: Students might not answer truthfully about honor code violations because:
Students might worry that admitting violations could lead to academic discipline, even if anonymity is promised.
Admitting to academic dishonesty violates social norms and personal identity as an ethical student.
Students might rationalize past behavior or genuinely not remember incidents which they did not consider serious violations at the time.
Non-Response Bias: Contacting participants through email creates opportunities for non-response.
Students routinely ignore emails that look like surveys or official communications.
Students might be particularly wary of emails asking about potentially incriminating behavior.
Students who have violated the pledge might be systematically less likely to respond.
Implications: The study would likely underestimate the true rate of honor code violations among pledge-taking students. This could lead to overly optimistic assessments of the pledge program’s effectiveness and inadequate attention to academic integrity issues.
8.7.3. Bias vs Variability
Understanding the distinction between bias and variability is crucial for interpreting research results and designing better studies. These two sources of error operate differently and require different strategies for management.
Conceptualizing Bias and Variability
Imagine the estimation process of a population parameter \(\theta\) as aiming at a target where the bullseye is \(\theta\) itself.
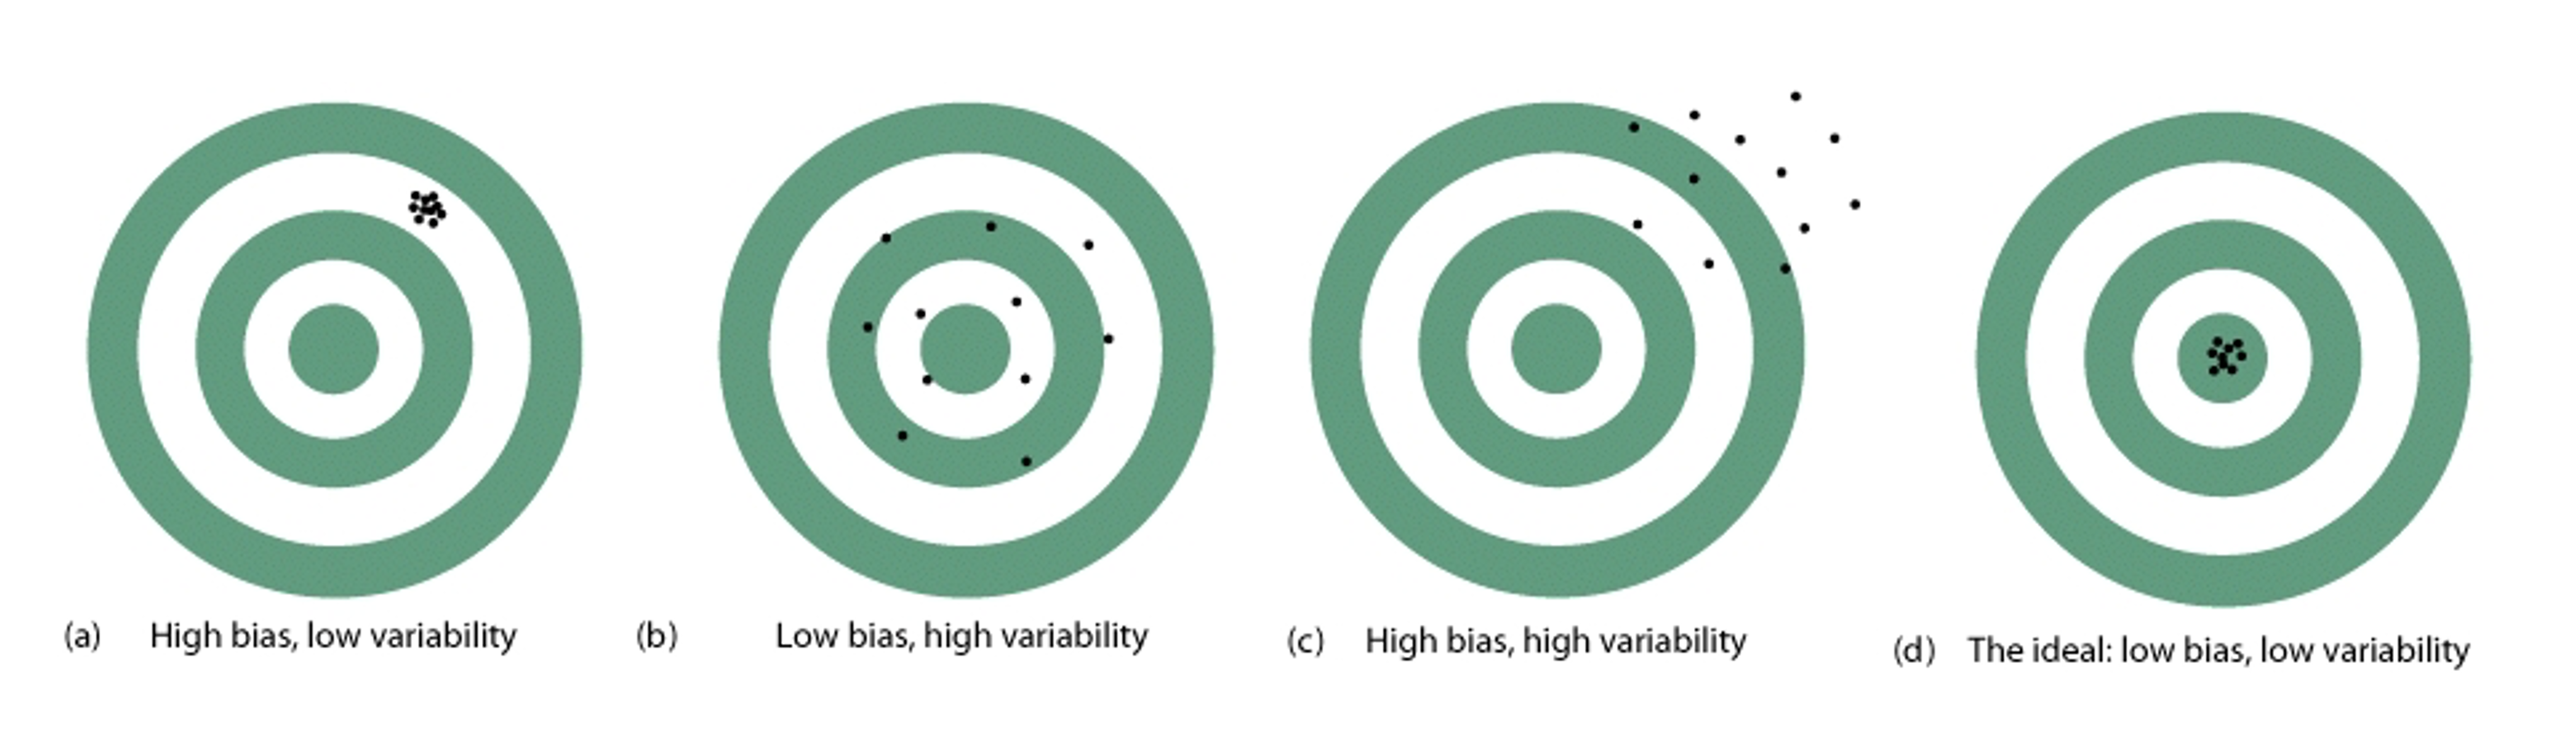
Fig. 8.14 Bias vs Variability
Scenario |
Bias |
||
|---|---|---|---|
High |
Low |
||
Variability |
High |
(c) The estimation procedure both misses the target systematically and produces highly variable results. This represents the worst-case scenario where we’re both inconsistent and wrong on average. |
(a) The estimation procedure consistently misses the target in the same direction. The estimates cluster tightly together, but they’re all systematically wrong. |
Low |
(b) The estimation procedure is correct on average—the center of the estimates hits the target—but individual estimates vary widely around the true value. This is typical with small random samples. |
(d) This represents the ideal situation where the estimation procedure is both consistent and accurate on average. This is what we strive for with large, well-designed random samples. |
|
Bias Threatens Validity, Variability Threatens Precision: Bias makes our conclusions wrong, while variability makes them uncertain.
Why This Distinction Matters
Larger sample sizes can reduce variability, but not bias. If our sampling procedure is biased, collecting more data using the same flawed procedure will only give us more precise estimates of the wrong value. Bias must be removed through careful design of the sampling procedure and of the experiment.
The Reality of Imperfect Studies
It’s important to recognize that no study is perfect, and the goal is not to eliminate all possible sources of bias—which is impossible—but to minimize bias where possible and interpret results appropriately given the limitations that remain.
8.7.4. Bringing It All Together
Key Takeaways 📝
Sampling bias is systematic error that consistently distorts results in predictable directions, unlike random error which averages out over repeated samples.
Non-random sampling guarantees bias, but even random sampling does not ensure its elimination.
Bias and variability are different. Bias makes conclusions wrong while variability makes them uncertain; bias cannot be reduced by larger sample sizes.
Real studies always have limitations. The goal is to minimize bias through careful design and interpret results appropriately and honestly.
This section completes our exploration of the foundations needed for statistical inference. In this chapter, we’ve learned that:
Experimental design principles (control, randomization, replication) enable reliable statistical inference.
Sampling design determines whether results can be generalized to populations of interest.
Various forms of bias can threaten the validity of even well-designed studies.
Understanding these limitations is essential for interpreting research appropriately.
8.7.5. Exercises
These exercises develop your understanding of different types of sampling bias, the distinction between bias and variability, and strategies for recognizing and minimizing bias in studies.
Key Concepts
Types of Sampling Bias
Undercoverage bias: Target population members are missing from the sampling frame
Non-response bias: Selected individuals fail to participate or complete the study
Response bias: Participants give inaccurate answers (social desirability, poor recall, leading questions)
Bias vs. Variability
Bias: Systematic error that pushes results away from truth in a consistent direction
Variability: Random error that causes results to scatter unpredictably around the true value
Critical Distinction: Increasing sample size reduces variability but does NOT reduce bias.
Diagnostic Rule:
If the error persists as sample size increases → think bias
If the error shrinks as sample size increases → think variability
The Bias-Variability Target Analogy
Low bias, low variability: Accurate and precise (ideal)
Low bias, high variability: Correct on average but imprecise
High bias, low variability: Precisely wrong
High bias, high variability: Inaccurate and imprecise (worst case)
Exercise 1: Identifying Bias Types
For each scenario, identify the primary type of sampling bias (undercoverage, non-response, or response) and explain how it could affect the study conclusions.
A health survey is conducted by telephone, but researchers only call landline numbers.
A university sends an email survey about campus dining to all students. Only 12% respond.
Employees are surveyed about workplace safety concerns in face-to-face interviews with their supervisors present.
A political poll excludes people who don’t speak English.
A customer satisfaction survey asks: “How excellent was your experience today?” with options from “Very Excellent” to “Somewhat Excellent.”
A study on alcohol consumption asks participants to recall how many drinks they had in the past year.
Solution
Part (a): Undercoverage bias
Explanation: Adults with only cell phones (no landline) are excluded from the sampling frame. This group skews younger, lower income, and more mobile — potentially with different health behaviors.
Effect: Results will overrepresent older, more affluent, settled populations. Health metrics (like preventive care rates, chronic conditions, health behaviors) may not reflect the full adult population.
Part (b): Non-response bias
Explanation: 88% of students didn’t respond. Those who respond likely differ from non-respondents — possibly those with strong opinions (positive or negative) about dining, or those with more time/engagement.
Effect: Opinions of the 12% may not represent all students. If dissatisfied students are more motivated to complain (or if satisfied students want to give positive feedback), results will be skewed.
Important note: A low response rate alone does not prove non-response bias — it signals risk. Bias depends on whether respondents differ systematically from non-respondents on the variables of interest.
Part (c): Response bias
Explanation: With supervisors present, employees may fear retaliation for honest answers about safety concerns. Social desirability pressure leads to underreporting of problems.
Effect: Safety concerns will be systematically underreported, giving management a false sense that the workplace is safer than employees actually believe.
Part (d): Undercoverage bias
Explanation: Non-English speakers are excluded from the sampling frame. This group may have different political views, experiences, and concerns.
Effect: Poll results won’t capture the views of immigrant communities and others who don’t speak English, potentially missing important perspectives on issues like immigration policy.
Part (e): Response bias (due to leading question)
Explanation: The question wording assumes excellence and offers no negative response options. This is a leading question that pushes respondents toward positive responses.
Effect: Satisfaction will be artificially inflated because even unhappy customers have no way to express dissatisfaction within the response options.
Part (f): Response bias (recall bias)
Explanation: Asking about consumption over an entire year requires accurate memory of routine behaviors. People tend to underestimate socially undesirable behaviors and have poor recall for frequent, similar events.
Effect: Alcohol consumption will likely be systematically underreported, leading to underestimates of drinking prevalence and heavy drinking.
Exercise 2: Multiple Biases in a Single Study
The following study description contains multiple potential biases. Identify and explain each one.
“A fitness company wanted to assess the effectiveness of its home workout app. Researchers posted a link to an online survey on the app’s social media pages asking users to report their weight loss over the past 6 months. The survey received 8,500 responses, and results showed an average weight loss of 12 pounds.”
Identify the sampling method and explain why it’s problematic.
Identify at least three specific types of bias that could affect these results.
In which direction would each bias likely push the results (overestimate or underestimate weight loss)?
Propose a better study design to evaluate the app’s effectiveness.
Solution
Part (a): Sampling method
This is voluntary response sampling — users who see the social media post choose whether to respond. This is problematic because:
Only active social media followers see the survey
Participation depends on personal motivation
No random selection; no control over who responds
Part (b): Three types of bias
Voluntary response bias / selection bias: Users who had positive experiences (lost weight) are more motivated to share their success story. Those who didn’t lose weight or quit using the app likely don’t respond.
Undercoverage bias: Only reaches people who follow the company’s social media AND see the post. Excludes users who don’t use social media, former users who unfollowed, and users who signed up but never engaged.
Response bias (self-report and social desirability): Weight loss is self-reported without verification. People may exaggerate their success (consciously or unconsciously) because they want to feel their effort was worthwhile or to please the company.
Survivorship bias: The sample only includes people still engaged with the app (following social media). Users who tried the app, saw no results, and quit are systematically excluded.
Part (c): Direction of bias
All biases point toward overestimating weight loss:
Voluntary response: Successful users more likely to respond → overestimate
Undercoverage of non-engaged users: Missing people who didn’t succeed → overestimate
Self-report bias: People exaggerate or misremember in favorable direction → overestimate
Survivorship: Only includes people still using/following → overestimate
The 12-pound average is almost certainly higher than the true average for all users who tried the app.
Part (d): Better study design
Option 1: Randomized controlled trial
Recruit participants interested in weight loss
Randomly assign half to use the app, half to a control condition (no app, or alternative approach)
Measure weight objectively (in-person weigh-ins) at baseline and 6 months
Compare weight change between groups
Option 2: Improved observational study
Select a random sample from all registered users (not just social media followers)
Actively contact selected users (don’t rely on voluntary response)
Verify weight loss with objective measurements or medical records
Track non-responders and compare their app engagement to responders
Exercise 3: Bias vs. Variability
For each scenario, determine whether the primary problem is bias, variability, or both, and explain your reasoning.
Three independent polls on the same day show candidate support at 48%, 51%, and 49% respectively. Election results show the candidate received 50% of the vote.
A scale at a doctor’s office consistently reads 3 pounds heavier than other calibrated scales. Patients weighed multiple times on this scale get very similar readings.
A marketing survey consistently overestimates product interest because it only samples loyal customers. Results fluctuate between 75% and 85% interested across different surveys.
A new blood pressure device gives readings that scatter randomly around the true value, sometimes too high and sometimes too low.
Political polls conducted by calling landline phones consistently underestimate youth voter turnout, regardless of sample size.
Solution
Part (a): Variability (low bias)
Explanation: The three polls center around the true value (50%), with results spanning 48-51%. This is random sampling variation — different samples give slightly different results, but they’re scattered around the truth.
Characteristics: Low bias (average is close to truth), moderate variability (3-percentage-point spread is normal for polls).
Part (b): Bias (low variability)
Explanation: The scale is consistently 3 pounds off — this is systematic error (bias). The high repeatability (similar readings) indicates low variability. This is the “precisely wrong” scenario.
Characteristics: High bias (always 3 pounds too heavy), low variability (consistent readings).
Part (c): Both bias and variability
Explanation: The consistent overestimation (75-85% vs. presumably lower true interest) indicates bias from sampling only loyal customers. The 10-percentage-point fluctuation between surveys indicates additional variability.
Characteristics: High bias (always overestimates), moderate variability (10-point spread).
Part (d): Variability (low bias)
Explanation: Readings scatter “randomly around the true value” — sometimes high, sometimes low, but centered on truth. This is random measurement error without systematic deviation.
Characteristics: Low bias (correct on average), some variability (readings differ from each other).
Part (e): Bias (not affected by sample size)
Explanation: “Regardless of sample size” is the key phrase — larger samples would reduce variability but the underestimate persists. This indicates systematic bias from undercoverage of young voters (who don’t have landlines).
Characteristics: Systematic bias from sampling method. Increasing sample size won’t help because you’re getting more precise estimates of the wrong thing.
Exercise 4: The Michigan Lead Study
Refer to the Michigan Lead Poisoning Study described in the chapter: 5,000 homes were sampled from municipalities across Michigan, but some municipalities were skipped due to high crime rates, and 73 homes couldn’t be tested due to resident refusal.
Identify the two types of bias present in this study.
For each bias, explain how it could cause the study to underestimate lead poisoning risk.
Why is this combination of biases particularly concerning for public health policy?
If the study had simply increased the sample size to 10,000 homes (using the same methodology), would this address the bias problems? Explain.
Solution
Part (a): Two types of bias
Undercoverage bias: High-crime municipalities were excluded from the sampling frame.
Non-response bias: 73 homes refused testing.
Part (b): How each causes underestimation
Undercoverage (excluded high-crime areas):
High-crime areas often correlate with poverty and older housing stock
Older homes are more likely to have lead paint
Low-income areas have less access to lead remediation
The highest-risk communities were systematically excluded
Result: Lead exposure rates appear lower than true statewide rates
Non-response (refusals):
Homeowners who know or suspect lead problems may refuse to avoid: - Legal obligations to remediate - Property value decreases - Liability concerns
Landlords especially may refuse to protect themselves
Result: Homes with actual lead problems are underrepresented
Part (c): Why this is particularly concerning
Both biases work in the same direction — toward underestimating the problem:
Policymakers using this data will underestimate the scope of lead exposure
Resources will be allocated based on artificially low estimates
The most vulnerable communities (low-income, high-risk areas) are invisible in the data
Children in these excluded areas remain at risk
Public health interventions will be inadequate
The combination creates a false sense of security about a serious public health issue.
Part (d): Would doubling sample size help?
No, increasing sample size would NOT address these biases.
Doubling to 10,000 homes would still exclude high-crime municipalities (undercoverage persists)
Refusal rates might stay proportionally similar (non-response persists)
The study would get more precise estimates of the wrong value
Larger sample = lower variability, but bias remains unchanged
To address the biases, the methodology itself must change: - Find ways to safely sample in high-crime areas (police escort, mobile testing units) - Implement follow-up protocols for refusals (incentives, anonymous testing, alternative approaches) - Stratify sampling to ensure high-risk areas are represented
Exercise 5: Non-Response Patterns
A workplace wellness survey achieves the following response rates:
Management: 85% response rate
Professional staff: 60% response rate
Administrative staff: 45% response rate
Hourly workers: 25% response rate
The survey asks about job satisfaction, stress levels, and health behaviors.
What type of bias is this differential response pattern creating?
If the true average job satisfaction across all employees is 6.5 on a 10-point scale, but management’s average is 7.8, how might the differential response rates affect the survey’s overall satisfaction estimate?
Suggest three strategies to improve response rates among underrepresented groups.
If improving response rates is not possible, what information would help you assess the magnitude of bias?
Solution
Part (a): Type of bias
Non-response bias — differential non-response across employee groups. The sample of respondents doesn’t represent the full workforce because participation rates vary systematically by job category.
Part (b): Effect on satisfaction estimate
Management is heavily overrepresented (85% response) while hourly workers are underrepresented (25% response). Since management reports higher satisfaction (7.8 vs. overall 6.5), the survey will likely overestimate overall job satisfaction.
Calculation example: If the workforce is 10% management, 20% professional, 30% admin, 40% hourly: - Actual weight of management in workforce: 10% - Weight of management among respondents: much higher (because 85% of them responded vs. 25% of hourly)
The overrepresentation of satisfied managers pulls the average up.
Part (c): Strategies to improve response rates
Time accommodation: Allow work-time completion for hourly workers who can’t take surveys home. Provide brief, tablet-based surveys during breaks.
Anonymity assurance: Hourly workers may fear management reprisal. Emphasize anonymity, use third-party survey administration, and show how individual responses cannot be identified.
Incentives: Offer meaningful incentives (raffle prizes, extra break time, small gift cards) to increase motivation across all groups.
Follow-up: Send reminders specifically targeting low-response groups. Have supervisors (trained not to pressure) encourage participation. Extend deadline for underrepresented groups.
Survey accessibility: Ensure surveys work on mobile phones, are available in multiple languages if needed, and don’t require email access.
Part (d): Information to assess bias magnitude
Demographic composition: What percentage of the workforce is in each category? This helps calculate how skewed the respondent pool is.
Response patterns in previous surveys: Do certain groups consistently under-respond? What were their reported values?
Administrative data on job satisfaction proxies: Turnover rates, absenteeism, grievance filings by job category might indicate whether low-responding groups are less satisfied.
Sample of non-respondents: A small, intensive effort to collect data from randomly selected non-respondents could estimate how different they are from respondents.
External benchmarks: Industry data on satisfaction by job level could provide comparison points.
Exercise 6: Designing to Minimize Sampling Bias
You are designing a study to estimate the proportion of adults in your city who exercise regularly.
For each potential source of bias, explain (a) how it could manifest, and (b) describe design features to minimize it.
Undercoverage bias
Non-response bias
Response bias
Solution
1. Undercoverage Bias
(a) How it could manifest:
Using phone directories excludes cell-phone-only households (common among younger adults)
Using voter rolls excludes non-registered adults
Using address lists excludes homeless individuals and those in group housing
Using gym membership lists obviously excludes non-exercisers
(b) Design features to minimize:
Comprehensive sampling frame: Use a combination of sources (address-based sampling, random digit dialing including cell phones, census tract sampling)
Area probability sampling: Randomly select geographic areas, then households within areas, to capture all residents regardless of phone/registration status
Oversampling hard-to-reach groups: If certain demographics are known to be undercovered, deliberately include more sampling in those areas
Multi-mode contact: Reach people through multiple channels (phone, mail, in-person) to increase coverage
2. Non-Response Bias
(a) How it could manifest:
People who exercise may be too busy to respond (at the gym, working out, active lifestyles)
People who don’t exercise may be less engaged or interested in health topics
Lower response among certain demographics (working adults, parents of young children)
Survey fatigue — people refuse all surveys regardless of topic
(b) Design features to minimize:
Multiple contact attempts: Contact non-responders repeatedly at different times/days
Short survey: Minimize respondent burden to increase completion rates
Incentives: Offer compensation for participation
Flexible modes: Offer online, phone, and mail options; let respondents choose
Track non-response: Record demographics of non-responders to assess potential bias direction
Non-response follow-up: Conduct intensive follow-up with a subsample of non-responders to compare their exercise patterns to responders
3. Response Bias
(a) How it could manifest:
Social desirability: People overreport exercise because it’s viewed positively
Recall error: People misremember or estimate frequency inaccurately
Definition ambiguity: “Regular exercise” means different things to different people (does walking to work count? Gardening?)
Question ordering: Previous health questions might prime more positive exercise responses
(b) Design features to minimize:
Neutral question wording: Use non-judgmental phrasing; don’t signal expected answers
Specific, defined behaviors: Ask “How many times in the past 7 days did you do physical activity for at least 30 minutes that made you breathe hard?” rather than “Do you exercise regularly?”
Behavioral anchoring: Ask about specific recent behaviors, not general patterns
Private response modes: Self-administered surveys may yield more honest answers than interviewer-administered
Validation substudy: For a subset, compare self-reports to objective measures (fitness tracker data, gym attendance records)
8.7.6. Additional Practice Problems
True/False Questions
Increasing sample size can reduce both bias and variability.
Non-response bias only occurs when fewer than 50% of selected individuals respond.
Response bias can occur even in studies with perfect sampling and 100% response rates.
A biased estimate from a large sample is generally more accurate than an unbiased estimate from a small sample.
Undercoverage bias occurs when selected individuals refuse to participate.
The direction of bias is always toward overestimating the quantity of interest.
Multiple Choice Questions
A scale consistently measures 5 pounds too heavy. This illustrates:
Ⓐ High bias, low variability
Ⓑ Low bias, high variability
Ⓒ High bias, high variability
Ⓓ Low bias, low variability
A researcher asks college students about illegal drug use in face-to-face interviews. The most likely source of bias is:
Ⓐ Undercoverage bias
Ⓑ Non-response bias
Ⓒ Response bias (social desirability)
Ⓓ Sampling frame error
If a polling organization wants to reduce bias in their results, they should:
Ⓐ Increase sample size
Ⓑ Improve sampling methodology
Ⓒ Use more decimal places in reporting
Ⓓ Weight results by political party
A study using voter registration lists to sample “all adults” suffers from:
Ⓐ Response bias
Ⓑ Non-response bias
Ⓒ Undercoverage bias
Ⓓ Measurement error
In the target analogy for bias and variability, an archer who consistently hits the same spot 6 inches left of the bullseye demonstrates:
Ⓐ Low bias, low variability
Ⓑ High bias, low variability
Ⓒ Low bias, high variability
Ⓓ High bias, high variability
Which scenario describes non-response bias?
Ⓐ The phone directory doesn’t include cell phone numbers
Ⓑ Respondents lie about their income
Ⓒ Selected participants refuse to complete the survey
Ⓓ The survey question is confusingly worded
Answers to Practice Problems
True/False Answers:
False — Increasing sample size reduces variability but has no effect on bias. Bias is systematic error from methodology, not sample size.
False — Non-response bias can occur with any response rate if responders systematically differ from non-responders. Even 80% response can be biased if the 20% who didn’t respond are systematically different.
True — Response bias occurs when people give inaccurate answers, which can happen regardless of sampling and response rates.
False — A biased estimate is systematically wrong; larger samples just give more precise estimates of the wrong value. An unbiased small sample estimate, while imprecise, is at least correct on average.
False — That describes non-response bias. Undercoverage is when population members are missing from the sampling frame before selection.
False — Bias can push estimates in either direction (over or under) depending on the specific situation.
Multiple Choice Answers:
Ⓐ — Consistent systematic error (5 lbs too heavy = high bias) with reproducible measurements (low variability).
Ⓒ — Face-to-face questions about illegal behavior create social desirability pressure to underreport.
Ⓑ — Bias comes from methodology; only changing the sampling approach can reduce bias.
Ⓒ — Non-registered voters (adults who are still part of “all adults”) are excluded from the sampling frame.
Ⓑ — Consistently hitting the same wrong spot = high bias (off target) + low variability (consistent).
Ⓒ — Non-response bias occurs when selected participants don’t participate. (A = undercoverage, B = response bias, D = measurement/question wording issue)