Slides 📊
1.2. Probability & Statistical Inference: How Are They Associated?
This course can be split into two main parts. The first half considers probability, and the second half focuses on statistical inference. In this section, we discuss how these two broad concepts are different yet closely associated.
Road Map 🧭
Define population and sample, and use their concepts to distinguish between probability and statistical inference.
1.2.1. Population and Sample
Population represents the entire collection of individuals or objects considered in our study.
Sample is a subset of the entire population—a small selection of individuals or objects taken from the complete collection.
1.2.2. The “Two Arrows” Diagram
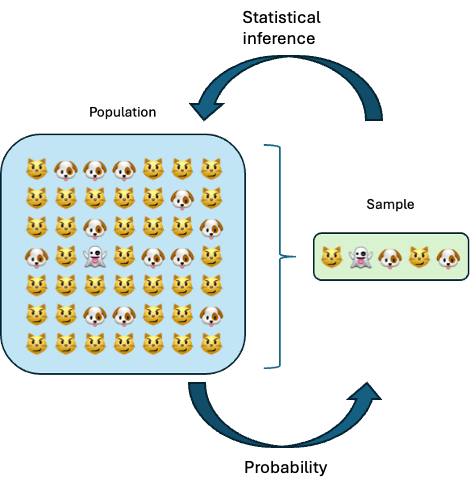
Fig. 1.5 The “two arrows” diagram
We express probability and statistical inference using one-sided arrows between sample and population. In each case, we begin with the complete knowledge of the side from which the arrow originates. Using this knowledge, we try to make an informed guess about the side the arrow points to.
Probability: Population → Sample
What does it mean to have complete knowledge of the population? It means that we are aware of the rule by which the population generates random samples. We call this rule the probability distribution.
With respect to Fig. 1.5, for example, suppose we know
the set of possible outcomes (cat, dog, and ghost),
the count of each category in the population, and
that each individual has an equal chance of being selected into a sample and are independent of the others.
Then, it is possible to calculate the probability of observing any specific outcome in a sample. For example,
Suppose a single individual is randomly sampled. What is the probability that this is a cat?
Suppose a random sample of size 10 is taken. What is the probability that this sample consists of nine dogs and a cat?
…
In the case of Fig. 1.5, the probability distribution is described through a combination of graphics and words. In other cases, a probability distribution can be expressed as a table of possible values with their associated probabilities or, in more complex scenarios, as a function.
Example 💡: Population → Sample

Suppose we know that 36% of all Americans have a passport.
Q1. What is the probability that a randomly sampled American does not hold a passport?
Probabilities are always expressed in a 0-1 scale. The probability would be \(1-0.36 = 0.64\).
Q2. If we take a random sample of 20 Americans, what’s the probability that exactly 10 of them will have a passport?
Under the assumption that all Americans have an equal chance of being sampled and that their inclusion in the sample does not impact the status of others, the probability is
\({{20}\choose{10}} (0.36)^{10}(0.64)^{10} = 0.0779\)
‼️ At this stage, you do not need to fully follow how these numbers are computed. The takeaway from this example should be the understanding that knowing the probability distribution allows us to compute the likelihood of various events that can happen in a sample. If you want to understand the computational steps, revisit after Chapter 5.
Statistical Inference: Population ← Sample
Statistical inference begins with full access to a dataset – a single random sample from the population – but limited knowledge of the population’s probability distribution. It aims to understand the population through the sample while accounting for its limitations.
In Fig. 1.5, suppose we can only see the sample. From this, we would guess
that the population contains cats, dogs, and ghosts,
that there are fewer ghosts than cats or dogs, and
that cats and dogs take up similar proportions
However, we cannot rule out the possibility that the population contains a wider range of categories, nor can we be highly confident about the true proportions of the observed categories given how small the sample is.
Example 💡: Population ← Sample
Suppose we interview 20 Americans at random and find that 8 of them (40%) hold a passport.
Q1. What can we conclude about the percentage of all Americans who hold a passport?
If we were to make a point estimation, the best we could say is that around 40% of all Americans are estimated to hold a passport. In most cases, we would also numerically express the degree of uncertainty through further inference methods.
We are not ready to perform any formal uncertainty quantification, but we can begin to think how different factors might affect our confidence.
Q2. If all participants were interviewed at the entrance of Indianapolis International Airport, does the representativeness of the sample for all Americans increase or decrease? How does this impact the credibility of the 40% estimate?
It is reasonable to believe that individuals with passports are over-represented at this location. This would reduce the credibility of the 40% estimate for all Americans.
Q3. If the sample was larger than 20, while the percentage remained 40%, would our uncertainty increase or decrease?
By taking a larger sample, the sample becomes more representative of the population (imagine taking a “sample” as large as the entire population of the United States!). As a result, the uncertainty in the estimate would decrease.
Q4. Can you think of any other aspects of the problem that might affect the degree of uncertainty?
This question is left for you to explore on your own.
1.2.3. Looking Ahead
Throughout this course, you are encouraged to revisit these two fundamental directions of reasoning. Distinguishing between probability and statistical inference will clarify both the methods used and the conclusions that can be drawn in each context.
Quick Check ✔
When would a sample ever be preferable to a census of the entire population?
Can you describe the difference between probability and statistics in a few sentences?
Why can two different random samples yield different conclusions even when drawn from the same population?