Chapter 1 Summary: Foundations in Place
We have now established the conceptual, mathematical, and computational foundations for everything that follows in this course. Before moving to Part 2’s simulation methods, let’s synthesize what we’ve learned and see how these pieces fit together.
The Three Pillars of Chapter 1
Chapter 1 developed three interconnected pillars that support all computational methods in data science:
Pillar 1: Philosophical Foundations (Section 1.1)
We confronted the fundamental question: What does probability mean? This isn’t merely philosophical—your answer determines how you conduct inference, interpret results, and communicate findings.
Kolmogorov’s axioms provide the mathematical rules everyone accepts: non-negativity, normalization, and countable additivity. These axioms are interpretation-neutral—they specify how probabilities behave without dictating what they represent.
Frequentist interpretation views probability as long-run relative frequency. Parameters are fixed but unknown; only data are random. This leads to inference methods evaluated by their behavior across hypothetical repeated samples—confidence intervals, p-values, and error rate control.
Bayesian interpretation views probability as degree of belief. Parameters are uncertain and receive probability distributions. Bayes’ theorem mechanically updates prior beliefs into posterior beliefs given data, enabling direct probability statements about hypotheses and parameters.
The choice matters: Frequentists ask “What would happen if I repeated this procedure many times?” Bayesians ask “What should I believe given this evidence?” Both questions are legitimate; context determines which is more appropriate.
Pillar 2: Mathematical Machinery (Section 1.2)
We reviewed the probability distributions that model real phenomena—the mathematical objects that connect abstract probability to concrete data.
Distribution functions (PMF, PDF, CDF, quantile function) provide complete descriptions of random variables. The CDF \(F(x) = P(X \leq x)\) is universal; the quantile function \(F^{-1}(p)\) inverts it.
Discrete distributions (Bernoulli, Binomial, Poisson, Geometric, Negative Binomial) model counts, trials, and discrete events. Key relationships include: Binomial as sum of Bernoullis, Poisson as limit of Binomial for rare events, Negative Binomial as sum of Geometrics.
Continuous distributions (Uniform, Normal, Exponential, Gamma, Beta) model measurements, durations, and proportions. Key relationships include: Exponential as Gamma with shape 1, Chi-square as Gamma with specific parameters, Normal as limit of standardized sums (Central Limit Theorem).
Inference distributions (Student’s t, Chi-square, F) arise naturally when making inferences about normal populations with estimated variance.
Pillar 3: Computational Tools (Section 1.3)
We learned to generate random samples using Python’s ecosystem—the practical bridge from theory to simulation.
The ``random`` module provides lightweight, dependency-free sampling for prototyping and teaching.
NumPy’s ``Generator`` API delivers high-performance vectorized sampling essential for serious Monte Carlo work—50 to 100 times faster than Python loops.
SciPy’s ``scipy.stats`` offers the complete statistical toolkit: 100+ distributions with density functions, CDFs, quantile functions, fitting, and hypothesis tests.
Reproducibility requires explicit seeds; parallel computing requires independent streams via
SeedSequence.spawn().
How the Pillars Connect
These three pillars don’t stand in isolation—they form an integrated foundation:
Paradigms inform distribution choice. A Bayesian analyzing a proportion naturally thinks of the Beta distribution as a prior for \(p\) and the Binomial as the likelihood—leading to a Beta posterior (conjugacy). A frequentist analyzing the same data focuses on the sampling distribution of \(\hat{p}\), using the Normal approximation via the Central Limit Theorem for large samples or exact Binomial calculations for small ones.
Distributions enable computational methods. The inverse CDF method (Chapter 2) works because the Probability Integral Transform guarantees \(F^{-1}(U) \sim F\) when \(U \sim \text{Uniform}(0,1)\). Understanding distribution properties—like the memoryless property of the Exponential or the reproductive property of the Gamma—enables efficient simulation algorithms.
Computation validates theory. When we prove that \(\bar{X}_n \xrightarrow{P} \mu\) (Law of Large Numbers), we can verify this computationally by generating samples and watching convergence. When we derive that the sample variance \(S^2\) is unbiased for \(\sigma^2\), we can confirm via simulation. This interplay between proof and computation builds deep understanding.
Example 💡: Integrating All Three Pillars
Problem: Estimate \(P(X > 5)\) where \(X \sim \text{Gamma}(3, 2)\) (shape 3, scale 2).
Approach 1: Exact computation (Pillar 2)
from scipy import stats

gamma_dist = stats.gamma(a=3, scale=2)
prob_exact = gamma_dist.sf(5)  # Survival function = 1 - CDF
print(f"Exact: P(X > 5) = {prob_exact:.6f}")
Approach 2: Monte Carlo simulation (Pillar 3)
import numpy as np

rng = np.random.default_rng(42)
samples = rng.gamma(shape=3, scale=2, size=100_000)
prob_mc = np.mean(samples > 5)
se_mc = np.sqrt(prob_mc * (1 - prob_mc) / len(samples))
print(f"Monte Carlo: P(X > 5) ≈ {prob_mc:.6f} ± {1.96*se_mc:.6f}")
Interpretation depends on paradigm (Pillar 1)
Frequentist: The Monte Carlo estimate has a standard error; with 100,000 samples, we’re confident the true probability lies within the reported interval.
Bayesian: If we were uncertain about the Gamma parameters, we’d integrate over their posterior distribution to get a posterior predictive probability.
Result: Both approaches yield \(P(X > 5) \approx 0.4562\). The Monte Carlo estimate converges to the exact value as sample size increases—a computational demonstration of the Law of Large Numbers.
What Lies Ahead: The Road to Simulation
With foundations in place, Part 2 opens the black boxes. We’ll learn how the random number generators we’ve been using actually work:
Chapter 2: Monte Carlo Methods
Inverse CDF method: The workhorse algorithm. If you can compute \(F^{-1}(u)\), you can sample from \(F\). We’ll derive this from the Probability Integral Transform and implement samplers for Exponential, Weibull, and other distributions.
Box-Muller transformation: A clever trick converting uniform pairs to normal pairs using polar coordinates. We’ll prove why it works and implement it.
Rejection sampling: When inverse CDF is intractable, we propose from a simpler distribution and accept/reject. We’ll analyze efficiency and implement samplers for distributions like Beta and Gamma.
Monte Carlo integration: Estimating integrals (expectations) by averaging samples. We’ll quantify Monte Carlo error and understand the \(O(n^{-1/2})\) convergence rate.
Chapters 3–4: Inference and Resampling
Maximum likelihood estimation: Finding parameters that make observed data most probable.
Bootstrap methods: Resampling observed data to quantify uncertainty without distributional assumptions.
Cross-validation: Estimating predictive performance by systematically holding out data.
Chapter 5 and Beyond: Bayesian Computation
Markov chain Monte Carlo: When posteriors lack closed forms, we construct Markov chains whose stationary distributions are the posteriors we seek.
Metropolis-Hastings and Gibbs sampling: The workhorses of Bayesian computation.
Each method builds on the foundations established here. Understanding why the Normal distribution appears everywhere (Central Limit Theorem) helps you know when Normal-based inference is appropriate. Understanding the frequentist/Bayesian distinction helps you interpret bootstrap confidence intervals versus Bayesian credible intervals. Understanding Python’s random generation ecosystem lets you implement any method efficiently.
Key Takeaways 📝
Probability has multiple valid interpretations: Frequentist (long-run frequency) and Bayesian (degree of belief) approaches answer different questions and have different strengths. Modern practice often draws pragmatically from both.
Distributions are the vocabulary of uncertainty: Mastering the major distributions—their properties, relationships, and parameterizations—enables you to model diverse phenomena and understand the methods built upon them.
Computation bridges theory and practice: Python’s
random, NumPy, and SciPy provide the tools to simulate, verify, and apply probabilistic ideas. Reproducibility and performance require thoughtful choices.Foundations enable methods: The inverse CDF method requires understanding CDFs. Bootstrap requires understanding sampling distributions. MCMC requires understanding both Bayesian inference and convergence. Everything ahead builds on Chapter 1.
Course outcome alignment: This chapter addressed Learning Outcome 2 (comparing frequentist and Bayesian inference) and laid groundwork for LO 1 (simulation techniques), LO 3 (resampling methods), and LO 4 (Bayesian models via MCMC).
Chapter 1 Exercises: Synthesis Problems
These exercises integrate material from all three sections, requiring you to connect philosophical, mathematical, and computational perspectives.
A Note on These Exercises
Some exercises preview methods we will study in depth later:
Bayesian inference (Exercises 1b, 1d) introduces concepts covered thoroughly in Chapter 5: Bayesian Data Analysis, including prior distributions, posterior computation, and credible intervals.
The bootstrap (Exercise 3) previews resampling methods covered in Chapter 4: Resampling Methods, where we develop the theory and explore bootstrap variants.
The goal here is to build intuition and see these methods in action. Don’t worry if some details feel unfamiliar—we provide step-by-step guidance below, and you’ll master these techniques when we revisit them later.
Exercise 1: Paradigm Comparison via Simulation
A coin is flipped 20 times, yielding 14 heads.
Frequentist analysis: Compute a 95% confidence interval for \(p\) using the Normal approximation. Then compute the exact Clopper-Pearson interval using
scipy.stats.beta.ppf. Compare the two intervals.Hint: Normal Approximation CI
The sample proportion \(\hat{p} = x/n\) has approximate sampling distribution \(\hat{p} \sim N(p, p(1-p)/n)\) for large \(n\). Since we don’t know \(p\), we estimate the standard error as \(\widehat{\text{SE}} = \sqrt{\hat{p}(1-\hat{p})/n}\). The 95% CI is \(\hat{p} \pm 1.96 \times \widehat{\text{SE}}\).
Hint: Clopper-Pearson Exact CI
The Clopper-Pearson interval uses the relationship between the Binomial and Beta distributions. If \(X \sim \text{Binomial}(n, p)\), then finding the \(p\) values where \(P(X \geq x)\) or \(P(X \leq x)\) equals \(\alpha/2\) involves Beta quantiles:
Lower bound: \(p_L = B_{\alpha/2}(x, n-x+1)\) where \(B_q(a,b)\) is the \(q\)-th quantile of \(\text{Beta}(a, b)\)
Upper bound: \(p_U = B_{1-\alpha/2}(x+1, n-x)\)
This relationship arises because the Beta distribution is the conjugate prior for the Binomial, and there’s a duality: \(P(\text{Binomial}(n,p) \geq x) = P(\text{Beta}(x, n-x+1) \leq p)\).
Bayesian analysis: Using a \(\text{Beta}(\alpha=1, \beta=1)\) prior (uniform), derive the posterior distribution for \(p\). Compute the posterior mean and a 95% credible interval. How do these compare to the frequentist results?
Hint: Conjugate Prior
The Beta distribution is conjugate to the Binomial likelihood, meaning the posterior is also Beta. If the prior is \(p \sim \text{Beta}(\alpha_0, \beta_0)\) and we observe \(x\) successes in \(n\) trials, then:
\[\text{Posterior: } p | x \sim \text{Beta}(\alpha_0 + x, \beta_0 + n - x)\]The parameters \(\alpha_0\) and \(\beta_0\) can be interpreted as “prior pseudo-observations”: \(\alpha_0 - 1\) prior successes and \(\beta_0 - 1\) prior failures.
Hint: Beta Distribution Properties
For \(\text{Beta}(\alpha, \beta)\):
Mean: \(\frac{\alpha}{\alpha + \beta}\)
Mode (for \(\alpha, \beta > 1\)): \(\frac{\alpha - 1}{\alpha + \beta - 2}\)
Credible intervals: Use
scipy.stats.beta(a, b).ppf([0.025, 0.975])
Simulation verification: Generate 10,000 samples from the posterior and verify that your credible interval contains approximately 95% of the samples.
Hint
Use
scipy.stats.beta(a, b).rvs(size=10000, random_state=rng)to draw samples. Count what fraction fall between your CI bounds.Interpretation: Write one paragraph explaining what the frequentist confidence interval means and one paragraph explaining what the Bayesian credible interval means. A scientist asks “What’s the probability that \(p > 0.5\)?” How would each paradigm answer?
Hint: Key Philosophical Difference
Frequentist: Parameters are fixed constants; probability describes long-run frequencies of procedures
Bayesian: Parameters have probability distributions; we can make direct probability statements about parameters
For the Bayesian answer, compute \(P(p > 0.5 | \text{data}) = 1 - F(0.5)\) where \(F\) is the posterior CDF.
Solution
Part (a): Frequentist Analysis
We observe \(x = 14\) successes in \(n = 20\) trials. Our goal is to construct confidence intervals for the unknown population proportion \(p\).
Step 1: Compute the Point Estimate
The maximum likelihood estimator (MLE) for a binomial proportion is simply the sample proportion:
This is our best single guess for \(p\), but it doesn’t capture uncertainty.
Step 2: Normal Approximation Confidence Interval
The Normal approximation uses the Central Limit Theorem. For large \(n\), the sampling distribution of \(\hat{p}\) is approximately Normal:
Problem: We don’t know \(p\), so we estimate the standard error by plugging in \(\hat{p}\):
The 95% CI formula: For a 95% interval, we use \(z_{0.975} = 1.96\) (the 97.5th percentile of the standard normal):
Step 3: Clopper-Pearson Exact Confidence Interval
The Clopper-Pearson interval is called “exact” because it inverts the binomial distribution directly rather than using a Normal approximation. It guarantees at least 95% coverage for any true \(p\).
The idea: Find the smallest \(p_L\) such that observing 14 or more successes would be unlikely (probability \(\leq \alpha/2\)), and the largest \(p_U\) such that observing 14 or fewer successes would be unlikely.
The formulas use Beta quantiles (because the Beta and Binomial are related):
Lower bound: \(p_L = B_{0.025}(x, n-x+1) = B_{0.025}(14, 7)\)
Upper bound: \(p_U = B_{0.975}(x+1, n-x) = B_{0.975}(15, 6)\)
where \(B_q(a, b)\) is the \(q\)-th quantile of the Beta(\(a\), \(b\)) distribution.
Python Implementation:
import numpy as np
from scipy import stats

# Given data
n, x = 20, 14
p_hat = x / n  # MLE = 0.70
alpha = 0.05   # For 95% confidence

# ----- Normal Approximation CI -----
# Step 1: Compute estimated standard error
se = np.sqrt(p_hat * (1 - p_hat) / n)
print(f"Estimated SE: {se:.4f}")

# Step 2: Get z critical value for 95% CI
z = stats.norm.ppf(1 - alpha/2)  # z_0.975 = 1.96
print(f"z critical value: {z:.4f}")

# Step 3: Compute CI
ci_normal = (p_hat - z * se, p_hat + z * se)
print(f"Normal approximation 95% CI: ({ci_normal[0]:.4f}, {ci_normal[1]:.4f})")

# ----- Clopper-Pearson Exact CI -----
# Uses Beta distribution quantiles
lower_cp = stats.beta.ppf(alpha/2, x, n - x + 1)      # Beta(a=14, b=7)
upper_cp = stats.beta.ppf(1 - alpha/2, x + 1, n - x)  # Beta(a=15, b=6)
print(f"Clopper-Pearson exact 95% CI: ({lower_cp:.4f}, {upper_cp:.4f})")

# Compare widths
print(f"\nInterval widths:")
print(f"  Normal: {ci_normal[1] - ci_normal[0]:.4f}")
print(f"  Exact:  {upper_cp - lower_cp:.4f}")
Estimated SE: 0.1025
z critical value: 1.9600
Normal approximation 95% CI: (0.4992, 0.9008)
Clopper-Pearson exact 95% CI: (0.4572, 0.8811)

Interval widths:
  Normal: 0.4017
  Exact:  0.4239
Comparison of the Two Intervals:
Property |
Normal Approx. |
Clopper-Pearson |
|---|---|---|
Lower bound |
0.4992 |
0.4572 |
Upper bound |
0.9008 |
0.8811 |
Width |
0.4017 |
0.4239 |
Symmetric? |
Yes |
No |
Can exceed [0,1]? |
Yes (problematic) |
No (guaranteed) |
Coverage guarantee |
Approximate |
Exact ≥ 95% |
The Clopper-Pearson interval is asymmetric because we’re closer to 1 than to 0. The Normal approximation can perform poorly when \(n\) is small or \(p\) is near 0 or 1.
Part (b): Bayesian Analysis
Note
This exercise previews Bayesian inference, which we will study in depth in Chapter 5. Here we walk through the mechanics; Chapter 5 will develop the full theory.
Step 1: Specify the Prior Distribution
In Bayesian inference, we start with a prior distribution representing our beliefs about \(p\) before seeing the data.
We use \(p \sim \text{Beta}(1, 1)\), which equals the Uniform(0, 1) distribution. This is a “non-informative” prior saying we have no strong prior beliefs—all values of \(p\) are equally plausible before seeing data.
Step 2: Write Down the Likelihood
The likelihood function gives the probability of the observed data given \(p\):
This is the Binomial probability mass function, viewed as a function of \(p\) (not \(x\)).
Step 3: Apply Bayes’ Theorem
Bayes’ theorem combines prior and likelihood to get the posterior distribution:
Substituting:
This is proportional to a Beta distribution! Specifically:
This “conjugacy” (Beta prior + Binomial likelihood = Beta posterior) is a beautiful mathematical convenience we’ll exploit throughout Chapter 5.
Step 4: Compute Posterior Summaries
The Beta(\(\alpha\), \(\beta\)) distribution has known formulas:
Mean: \(\frac{\alpha}{\alpha + \beta} = \frac{15}{22} = 0.6818\)
Mode: \(\frac{\alpha - 1}{\alpha + \beta - 2} = \frac{14}{20} = 0.70\) (same as MLE!)
Variance: \(\frac{\alpha \beta}{(\alpha+\beta)^2(\alpha+\beta+1)} = \frac{15 \times 7}{22^2 \times 23} = 0.00943\)
The 95% credible interval uses the 2.5th and 97.5th percentiles of the posterior.
Python Implementation:
from scipy import stats

# Prior parameters: Beta(α=1, β=1) = Uniform(0,1)
alpha_prior, beta_prior = 1, 1

# Data
n, x = 20, 14

# Posterior parameters (conjugate update)
alpha_post = alpha_prior + x       # 1 + 14 = 15
beta_post = beta_prior + (n - x)   # 1 + 6 = 7

print(f"Prior: Beta(α={alpha_prior}, β={beta_prior})")
print(f"Data: {x} successes in {n} trials")
print(f"Posterior: Beta(α={alpha_post}, β={beta_post})")

# Create posterior distribution object
posterior = stats.beta(a=alpha_post, b=beta_post)

# Compute summaries
post_mean = posterior.mean()
post_var = posterior.var()
post_std = posterior.std()
post_median = posterior.median()
post_mode = (alpha_post - 1) / (alpha_post + beta_post - 2)

print(f"\nPosterior summaries:")
print(f"  Mean:   {post_mean:.4f}")
print(f"  Median: {post_median:.4f}")
print(f"  Mode:   {post_mode:.4f}")
print(f"  Std:    {post_std:.4f}")

# 95% Equal-tailed credible interval
ci_credible = posterior.ppf([0.025, 0.975])
print(f"\n95% Equal-tailed credible interval: ({ci_credible[0]:.4f}, {ci_credible[1]:.4f})")
Prior: Beta(α=1, β=1)
Data: 14 successes in 20 trials
Posterior: Beta(α=15, β=7)

Posterior summaries:
  Mean:   0.6818
  Median: 0.6874
  Mode:   0.7000
  Std:    0.0971

95% Equal-tailed credible interval: (0.4782, 0.8541)
Comparison to Frequentist Results:
The posterior mean (0.6818) is shrunk toward 0.5 compared to the MLE (0.70). Why? The Beta(1,1) prior adds “pseudocounts” of 1 success and 1 failure, pulling the estimate toward 0.5. With more data, this shrinkage becomes negligible.
Part (c): Simulation Verification
Why Simulate?
Simulation serves as a “sanity check” for analytical calculations. If our credible interval is correct, then approximately 95% of samples drawn from the posterior should fall within it. This is a powerful verification technique we’ll use throughout the course.
Step 1: Draw Samples from the Posterior
Use scipy.stats.beta.rvs() to generate random samples from \(\text{Beta}(\alpha=15, \beta=7)\):
Step 2: Count Samples in the Interval
For each sample, check if it falls between the lower and upper bounds of our credible interval. The proportion should be approximately 0.95.
Python Implementation:
import numpy as np
from scipy import stats

# Create a Generator for reproducibility
rng = np.random.default_rng(seed=42)

# Our posterior distribution: Beta(α=15, β=7)
alpha_post, beta_post = 15, 7
posterior = stats.beta(a=alpha_post, b=beta_post)

# Get the 95% credible interval bounds
ci_credible = posterior.ppf([0.025, 0.975])
print(f"Posterior: Beta(α={alpha_post}, β={beta_post})")
print(f"95% Credible interval: ({ci_credible[0]:.4f}, {ci_credible[1]:.4f})")

# Draw 10,000 samples from the posterior
# Pass rng to rvs() for reproducibility with the Generator API
n_samples = 10000
samples = posterior.rvs(size=n_samples, random_state=rng)

# Count how many fall within the credible interval
in_interval = np.sum((samples >= ci_credible[0]) & (samples <= ci_credible[1]))
proportion_in = in_interval / n_samples

print(f"\nSimulation results ({n_samples:,} samples):")
print(f"  Samples in CI: {in_interval:,} ({100*proportion_in:.2f}%)")
print(f"  Expected: ~{0.95*n_samples:.0f} (95.00%)")

# Also verify moments match theory
print(f"\nMoment verification:")
print(f"  Sample mean:  {np.mean(samples):.4f} (theoretical: {posterior.mean():.4f})")
print(f"  Sample std:   {np.std(samples):.4f} (theoretical: {posterior.std():.4f})")
print(f"  Sample median: {np.median(samples):.4f} (theoretical: {posterior.median():.4f})")
Posterior: Beta(α=15, β=7)
95% Credible interval: (0.4782, 0.8541)

Simulation results (10,000 samples):
  Samples in CI: 9,518 (95.18%)
  Expected: ~9500 (95.00%)

Moment verification:
  Sample mean:  0.6830 (theoretical: 0.6818)
  Sample std:   0.0964 (theoretical: 0.0971)
  Sample median: 0.6881 (theoretical: 0.6874)
Interpretation: We got 95.18%, very close to the expected 95%. Small deviations are due to Monte Carlo sampling error. The Law of Large Numbers guarantees this proportion converges to 0.95 as we increase the number of samples.
Part (d): Interpretation—The Fundamental Difference
The Key Question
A scientist asks: “What’s the probability that :math:`p > 0.5`?”
This seemingly simple question has fundamentally different answers depending on your statistical paradigm. Understanding this difference is crucial for interpreting results correctly.
Frequentist Interpretation of the Confidence Interval:
The 95% Clopper-Pearson interval (0.4572, 0.8811) does NOT mean:
❌ “There is a 95% probability that \(p\) lies in (0.4572, 0.8811)”
It DOES mean:
✓ “If we repeated this experiment many times (flip 20 coins, compute CI), then 95% of the resulting intervals would contain the true \(p\).”
The parameter \(p\) is a fixed (unknown) constant—it’s either in this interval or it isn’t. The probability statement is about the procedure, not about this specific interval.
Bayesian Interpretation of the Credible Interval:
The 95% credible interval (0.4782, 0.8541) means exactly what it sounds like:
✓ “Given our prior beliefs and the observed data, there is a 95% probability that \(p\) lies in (0.4782, 0.8541).”
This is a direct probability statement about the parameter, conditioned on our information.
Answering “What’s the probability that p > 0.5?”
import numpy as np
from scipy import stats

# ----- Bayesian Answer -----
posterior = stats.beta(15, 7)
prob_gt_half = 1 - posterior.cdf(0.5)  # P(p > 0.5 | data)
print("BAYESIAN APPROACH:")
print(f"  P(p > 0.5 | data) = {prob_gt_half:.4f} = {100*prob_gt_half:.2f}%")
print(f"  Interpretation: 'There is a {100*prob_gt_half:.1f}% probability")
print(f"                   that the true p exceeds 0.5.'")

# ----- Frequentist Answer -----
print("\nFREQUENTIST APPROACH:")
p_hat = 14/20
n = 20

# Test H0: p ≤ 0.5 vs H1: p > 0.5
# Under H0, use the boundary value p = 0.5 for the standard error
se_null = np.sqrt(0.5 * 0.5 / n)  # SE under null hypothesis
z = (p_hat - 0.5) / se_null
p_value = 1 - stats.norm.cdf(z)

print(f"  Test: H0: p ≤ 0.5 vs H1: p > 0.5")
print(f"  z-statistic = ({p_hat} - 0.5) / {se_null:.4f} = {z:.4f}")
print(f"  p-value = P(Z > {z:.4f}) = {p_value:.4f}")
print(f"  At α = 0.05: {'Reject H0' if p_value < 0.05 else 'Fail to reject H0'}")
print(f"\n  Interpretation: 'I cannot assign a probability to p > 0.5.")
print(f"                   But if p ≤ 0.5 (testing at boundary p = 0.5),")
print(f"                   we would see 14+ heads only {100*p_value:.1f}% of the time.'")
BAYESIAN APPROACH:
  P(p > 0.5 | data) = 0.9608 = 96.08%
  Interpretation: 'There is a 96.1% probability
                   that the true p exceeds 0.5.'

FREQUENTIST APPROACH:
  Test: H0: p ≤ 0.5 vs H1: p > 0.5
  z-statistic = (0.7 - 0.5) / 0.1118 = 1.7889
  p-value = P(Z > 1.7889) = 0.0368
  At α = 0.05: Reject H0

  Interpretation: 'I cannot assign a probability to p > 0.5.
                   But if p ≤ 0.5 (testing at boundary p = 0.5),
                   we would see 14+ heads only 3.7% of the time.'
Summary Table:
Aspect |
Frequentist |
Bayesian |
|---|---|---|
Parameters |
Fixed, unknown constants |
Random variables with distributions |
Probability applies to |
Data, procedures, long-run frequencies |
Parameters, hypotheses, beliefs |
Answer to “P(p>0.5)?” |
“Cannot answer; p is fixed” |
“96.08%, given data and prior” |
What 95% means |
95% of CIs from repeated sampling would contain true p |
95% probability p is in this interval (given our information) |
The Bayesian directly answers the scientist’s question. The frequentist provides related but fundamentally different information—evidence against \(p \leq 0.5\) rather than the probability that \(p > 0.5\).
Exercise 2: Distribution Relationships Through Simulation
The Poisson limit theorem states that \(\text{Binomial}(n, p=\lambda/n) \to \text{Poisson}(\lambda)\) as \(n \to \infty\).
For \(\lambda = 4\), generate 10,000 samples from \(\text{Binomial}(n, p=4/n)\) for \(n \in \{10, 50, 200, 1000\}\) and from \(\text{Poisson}(\lambda=4)\).
Hint: Why This Works
The Poisson approximation models “rare events in many trials.” If we have \(n\) independent trials each with small success probability \(p = \lambda/n\), the expected number of successes is \(np = \lambda\). As \(n \to \infty\) with \(\lambda\) fixed, the Binomial converges to Poisson(\(\lambda\)).
Use
rng.binomial(n=n, p=lam/n, size=10000)andrng.poisson(lam=lam, size=10000).For each sample, compute the sample mean and variance. The Poisson distribution has the property that mean equals variance. How quickly does the Binomial approach this property?
Hint: Variance Comparison
For \(\text{Binomial}(n, p)\): mean = \(np\), variance = \(np(1-p) = \lambda(1 - \lambda/n)\).
For \(\text{Poisson}(\lambda)\): mean = variance = \(\lambda\).
The ratio Var/Mean for Binomial is \(1 - \lambda/n\), which approaches 1 as \(n \to \infty\).
Create a visualization showing the PMFs converging. Use
scipy.stats.binom.pmfandscipy.stats.poisson.pmfto overlay theoretical PMFs on your histograms.Conduct a chi-square goodness-of-fit test comparing each Binomial sample to the \(\text{Poisson}(\lambda=4)\) distribution. How does the p-value change with \(n\)?
Hint: Chi-Square Test Setup
Bin observed counts: count how many samples equal 0, 1, 2, …, and group large values
Compute expected counts under \(\text{Poisson}(\lambda=4)\): \(E_k = n_{\text{samples}} \times P(X = k)\)
Combine bins where expected count < 5 (standard chi-square requirement)
Use
scipy.stats.chisquare(observed, expected)
Solution
Part (a) & (b): Sample Generation and Statistics
The Poisson limit theorem captures what happens when we have many trials with small success probability but constant expected count \(\lambda = np\).
import numpy as np
from scipy import stats

# Create a Generator for reproducibility
rng = np.random.default_rng(seed=42)

lam = 4  # Rate parameter λ
n_samples = 10000
n_values = [10, 50, 200, 1000]

print(f"{'Distribution':<30} {'Mean':>10} {'Variance':>10} {'Var/Mean':>10}")
print("-" * 62)

samples_dict = {}
for n in n_values:
    p = lam / n
    # Binomial(n=n, p=λ/n) samples
    samples = rng.binomial(n=n, p=p, size=n_samples)
    samples_dict[n] = samples
    mean = np.mean(samples)
    var = np.var(samples, ddof=1)
    print(f"Binomial(n={n}, p={lam}/{n}){'':<6} {mean:>10.4f} {var:>10.4f} {var/mean:>10.4f}")

# Poisson(λ=4) samples
poisson_samples = rng.poisson(lam=lam, size=n_samples)
samples_dict['Poisson'] = poisson_samples
mean = np.mean(poisson_samples)
var = np.var(poisson_samples, ddof=1)
print(f"{'Poisson(λ=4)':<30} {mean:>10.4f} {var:>10.4f} {var/mean:>10.4f}")
Distribution                         Mean   Variance   Var/Mean
--------------------------------------------------------------
Binomial(n=10, p=4/10)             3.9716     2.3488     0.5914
Binomial(n=50, p=4/50)             4.0289     3.7286     0.9255
Binomial(n=200, p=4/200)           3.9979     3.8705     0.9681
Binomial(n=1000, p=4/1000)         3.9904     3.9647     0.9936
Poisson(λ=4)                       4.0116     4.0369     1.0063
Key insight: For \(\text{Binomial}(n, p)\), variance \(= np(1-p) = \lambda(1 - \lambda/n)\). As \(n \to \infty\), this approaches \(\lambda\), matching Poisson. The Var/Mean ratio is \(1 - \lambda/n\), so it converges to 1 at rate \(O(1/n)\).
Part (c): Visualization of Convergence
import numpy as np
import matplotlib.pyplot as plt
from scipy import stats

rng = np.random.default_rng(seed=42)
lam = 4  # Rate parameter λ
n_samples = 10000
n_values = [10, 50, 200, 1000]

fig, axes = plt.subplots(2, 2, figsize=(12, 10))
x_vals = np.arange(0, 15)

for ax, n in zip(axes.flat, n_values):
    p = lam / n
    samples = rng.binomial(n=n, p=p, size=n_samples)

    # Histogram of samples
    ax.hist(samples, bins=np.arange(-0.5, 15.5, 1),
            density=True, alpha=0.7, label='Binomial samples')

    # Overlay Binomial(n, p) PMF
    binom_pmf = stats.binom.pmf(x_vals, n=n, p=p)
    ax.plot(x_vals, binom_pmf, 'b-o', markersize=6,
            label=f'Binomial(n={n}, p={p:.4f}) PMF')

    # Overlay Poisson(λ=4) PMF
    poisson_pmf = stats.poisson.pmf(x_vals, mu=lam)
    ax.plot(x_vals, poisson_pmf, 'r--s', markersize=5,
            label=f'Poisson(λ={lam}) PMF')

    ax.set_xlabel('k')
    ax.set_ylabel('Probability')
    ax.set_title(f'Binomial(n={n}, p={lam}/{n}) vs Poisson(λ={lam})')
    ax.legend()
    ax.set_xlim(-0.5, 14.5)

plt.tight_layout()
plt.savefig('poisson_limit_convergence.png', dpi=150)
plt.show()
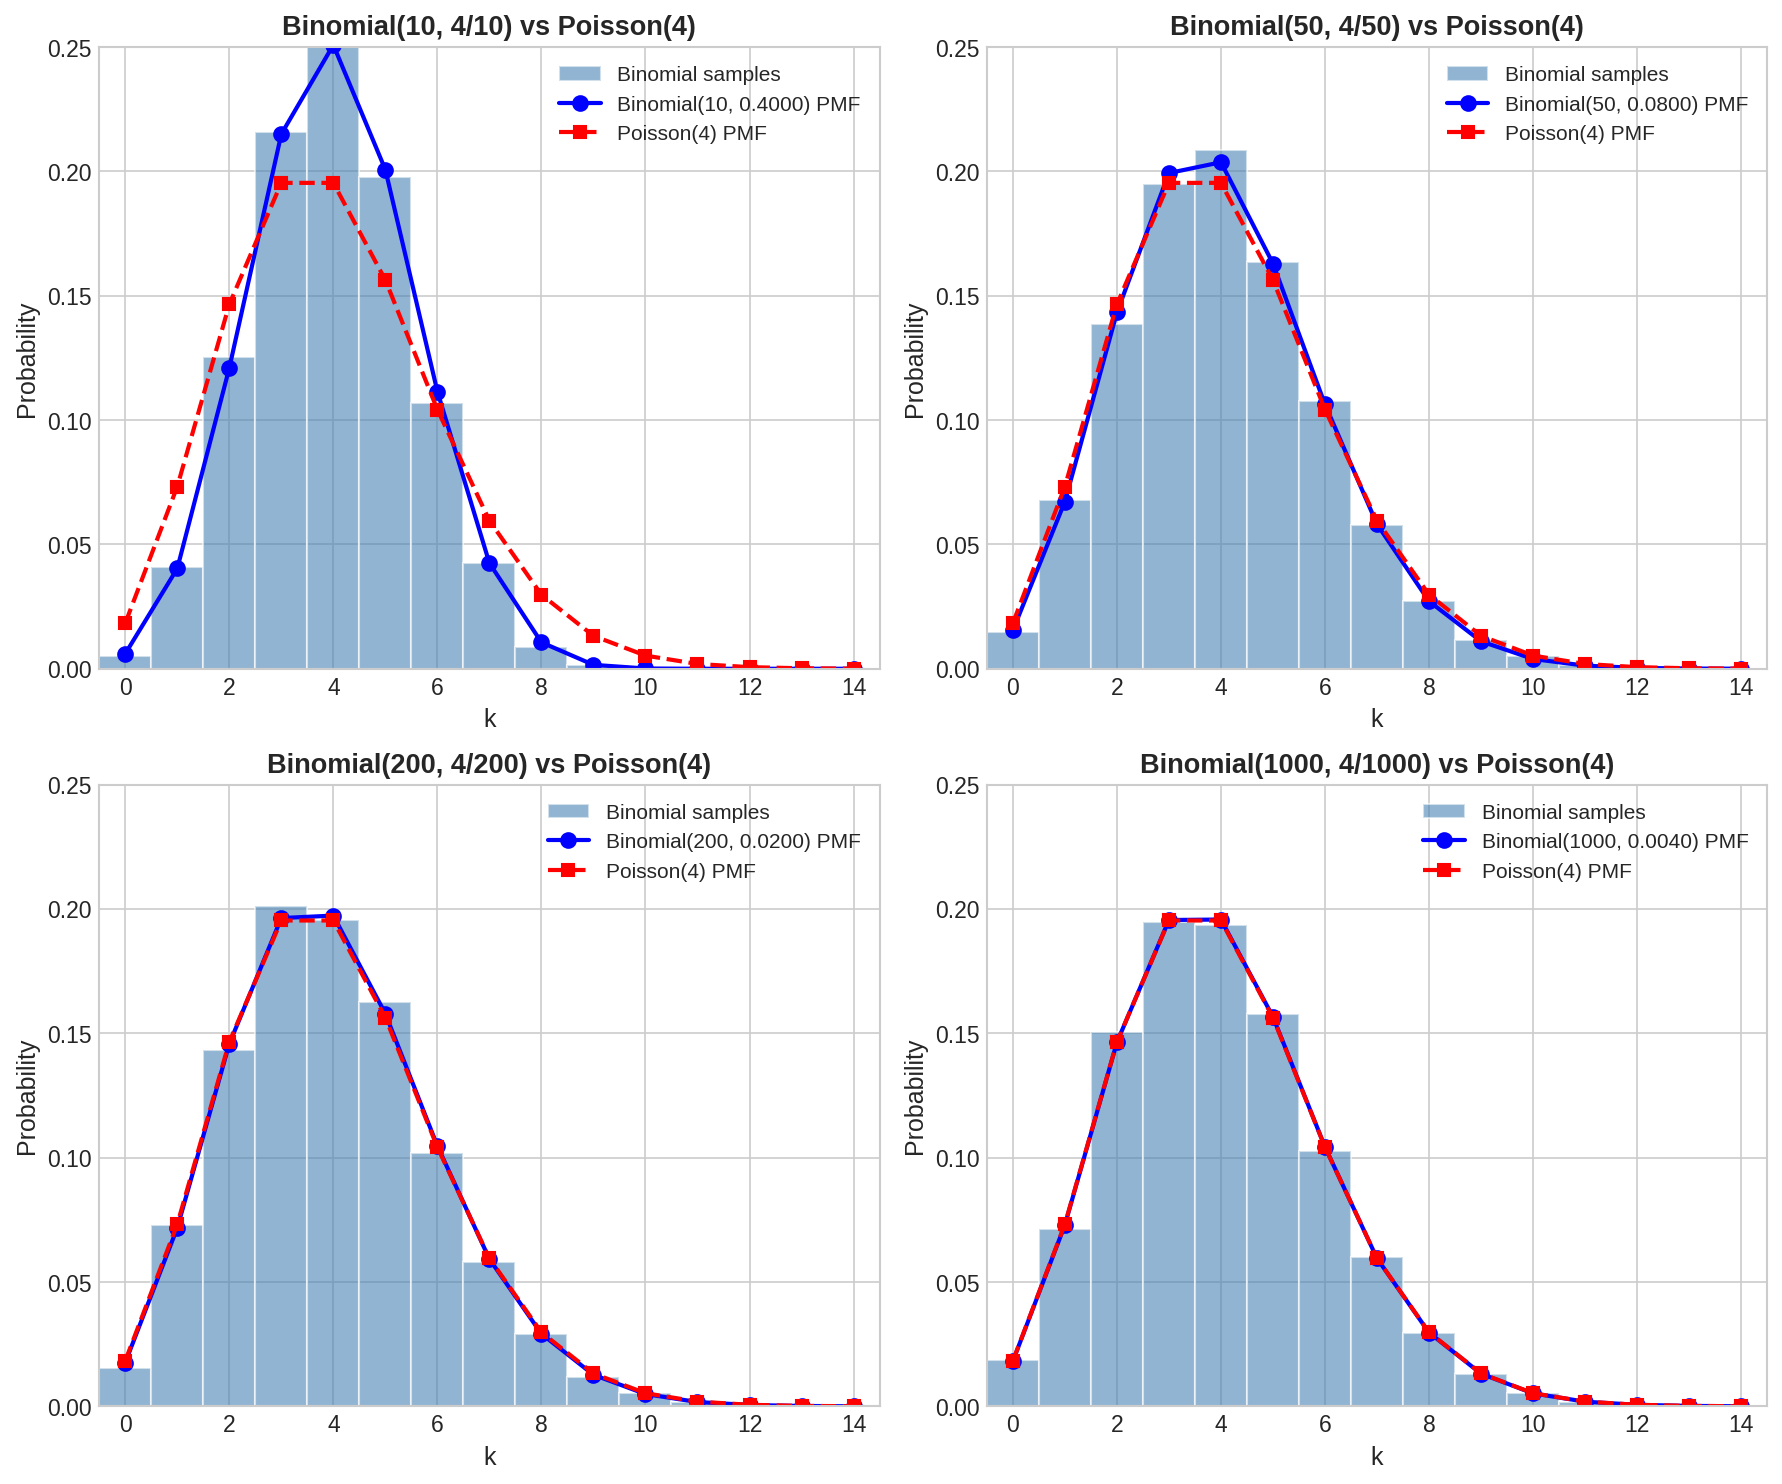
Fig. 25 Poisson Limit Theorem Visualization. As \(n\) increases, the \(\text{Binomial}(n, p=4/n)\) PMF (blue circles) converges to the \(\text{Poisson}(\lambda=4)\) PMF (red squares). By \(n = 1000\), the two distributions are visually indistinguishable.
The convergence rate can also be visualized by tracking the variance-to-mean ratio:
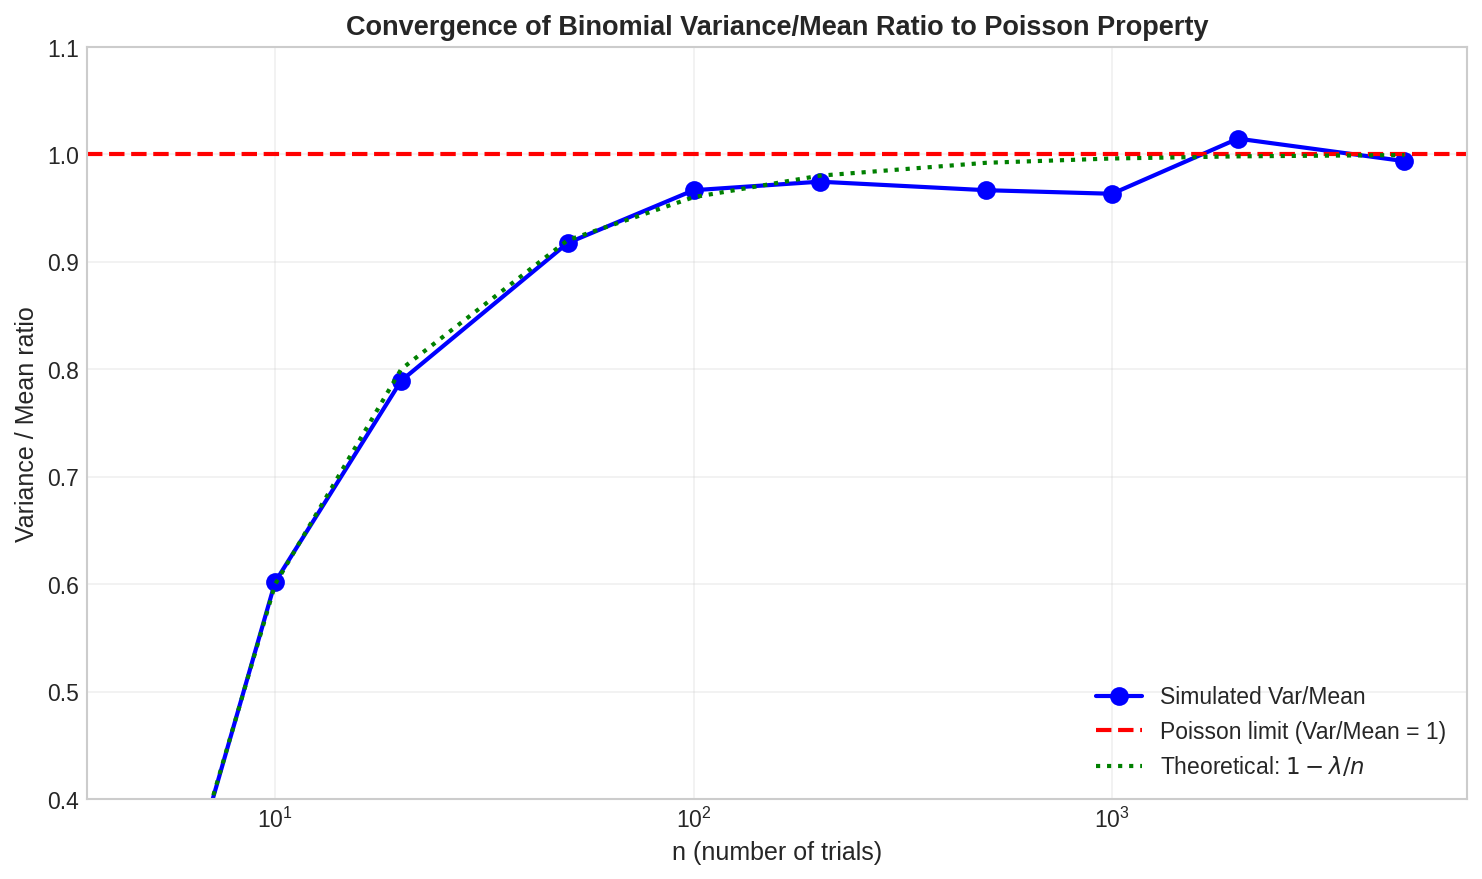
Fig. 26 Variance/Mean Ratio Convergence. The ratio approaches 1 (the Poisson property) at rate \(O(1/n)\).
Part (d): Chi-Square Goodness-of-Fit Tests
We test \(H_0\): the sample comes from \(\text{Poisson}(\lambda=4)\).
import numpy as np
from scipy import stats

rng = np.random.default_rng(seed=42)
lam = 4  # Rate parameter λ
n_samples = 10000

print(f"H₀: Sample comes from Poisson(λ={lam})")
print(f"{'Distribution':<30} {'χ² stat':>12} {'p-value':>10} {'Result':>15}")
print("-" * 70)

for n in [10, 50, 200, 1000, 'Poisson']:
    if n == 'Poisson':
        samples = rng.poisson(lam=lam, size=n_samples)
        name = f'Poisson(λ={lam})'
    else:
        samples = rng.binomial(n=n, p=lam/n, size=n_samples)
        name = f'Binomial(n={n}, p={lam}/{n})'

    # Bin counts: 0, 1, 2, ..., 10, 11+
    observed = [np.sum(samples == k) for k in range(11)]
    observed.append(np.sum(samples >= 11))
    observed = np.array(observed)

    # Expected under Poisson(λ=4)
    expected_probs = [stats.poisson.pmf(k, mu=lam) for k in range(11)]
    expected_probs.append(1 - stats.poisson.cdf(10, mu=lam))
    expected = np.array(expected_probs) * n_samples

    # Combine bins where expected < 5 (standard chi-square requirement)
    obs_comb, exp_comb = [], []
    obs_acc, exp_acc = 0, 0
    for o, e in zip(observed, expected):
        obs_acc += o
        exp_acc += e
        if exp_acc >= 5:
            obs_comb.append(obs_acc)
            exp_comb.append(exp_acc)
            obs_acc, exp_acc = 0, 0
    if exp_acc > 0:
        obs_comb[-1] += obs_acc
        exp_comb[-1] += exp_acc

    chi2_stat, p_val = stats.chisquare(obs_comb, exp_comb)
    result = "Fail to reject" if p_val > 0.05 else "Reject H₀"
    print(f"{name:<30} {chi2_stat:>12.2f} {p_val:>10.4f} {result:>15}")
H₀: Sample comes from Poisson(λ=4)
Distribution                       χ² stat    p-value          Result
----------------------------------------------------------------------
Binomial(n=10, p=4/10)              971.01     0.0000       Reject H₀
Binomial(n=50, p=4/50)               35.58     0.0002       Reject H₀
Binomial(n=200, p=4/200)             12.16     0.3519  Fail to reject
Binomial(n=1000, p=4/1000)            3.10     0.9893  Fail to reject
Poisson(λ=4)                         11.03     0.4409  Fail to reject
Interpretation: The chi-square test quantifies how distinguishable the Binomial is from Poisson:
At \(n = 10\), the Binomial is decisively different (\(\chi^2 = 971\), \(p \approx 0\))
At \(n = 50\), still significantly different (\(p = 0.0002\))
At \(n = 200\), no longer statistically distinguishable (\(p = 0.35\))
At \(n = 1000\), virtually identical (\(p = 0.99\))
With 10,000 samples, we have high power to detect small differences. The transition around \(n = 100\text{-}200\) is where the Poisson approximation becomes practically useful for typical statistical tests.
Exercise 3: The Bootstrap Preview
The bootstrap (Chapter 4) estimates sampling distributions by resampling observed data. This exercise previews the idea.
Background: The Sampling Distribution Problem
When we compute a statistic like \(\bar{x}\) from a sample, we get one number. But if we collected a different sample, we’d get a different \(\bar{x}\). The sampling distribution describes this variability—but we only have one sample! The bootstrap solves this by treating our sample as a miniature population.
Generate a sample of \(n = 50\) observations from \(\text{Gamma}(\text{shape}=3, \text{scale}=2)\). Compute the sample mean \(\bar{x}\).
Hint: Gamma Distribution Properties
For \(\text{Gamma}(\text{shape}=\alpha, \text{scale}=\theta)\):
Mean: \(\mu = \alpha \theta\)
Variance: \(\sigma^2 = \alpha \theta^2\)
Use
rng.gamma(shape=3, scale=2, size=50)whererng = np.random.default_rng(seed=42).Create 5,000 bootstrap samples by sampling \(n = 50\) observations with replacement from your original sample. For each bootstrap sample, compute the mean \(\bar{x}^*_b\).
Hint: Resampling With Replacement
“With replacement” means each draw is independent—after drawing an observation, it goes back into the pool. This means:
Some original observations will appear multiple times in a bootstrap sample
Some original observations won’t appear at all
Each bootstrap sample has the same size as the original (\(n = 50\))
Use
rng.choice(original_sample, size=n, replace=True)for each bootstrap iteration.The bootstrap distribution of \(\bar{x}^*\) approximates the sampling distribution of \(\bar{x}\). Compute the 2.5th and 97.5th percentiles of your bootstrap means to form a 95% bootstrap confidence interval.
Hint: Percentile Method
The simplest bootstrap CI uses empirical percentiles:
Lower bound = 2.5th percentile of bootstrap means
Upper bound = 97.5th percentile of bootstrap means
Use
np.percentile(bootstrap_means, [2.5, 97.5]).Compare to the theoretical sampling distribution: \(\bar{X} \sim \text{approximately } N(\mu, \sigma^2/n)\) where \(\mu = 6\) and \(\sigma^2 = 12\) for \(\text{Gamma}(\text{shape}=3, \text{scale}=2)\). How well does the bootstrap interval match the theoretical interval?
Hint: Central Limit Theorem
By CLT, \(\bar{X} \approx N(\mu, \sigma^2/n)\), so the theoretical SE is \(\sigma/\sqrt{n}\). Compare:
Theoretical SE: \(\sqrt{12}/\sqrt{50} \approx 0.49\) (requires knowing \(\sigma\))
Bootstrap SE: standard deviation of bootstrap means (requires only the sample)
Discuss: The bootstrap works without knowing the true distribution. Why is this valuable in practice?
Solution
Note
This exercise previews bootstrap methods, which we will study comprehensively in Chapter 4: Resampling Methods. Here we build intuition; Chapter 4 develops the theory, variants (percentile, BCa, parametric bootstrap), and applications.
The Big Idea Behind the Bootstrap
We want to understand the sampling distribution of a statistic (like the sample mean)—how much would it vary if we could repeat our experiment many times? The problem: we only have one sample!
The bootstrap solution: Treat your sample as a stand-in for the population. Resample from it (with replacement) to simulate repeated sampling. The variation in the resampled statistics approximates the true sampling variation.
Part (a): Generate Original Sample
Step 1: Understand the True Distribution
We’re sampling from \(\text{Gamma}(\text{shape}=3, \text{scale}=2)\). The Gamma distribution has:
Mean: \(\mu = \text{shape} \times \text{scale} = 3 \times 2 = 6\)
Variance: \(\sigma^2 = \text{shape} \times \text{scale}^2 = 3 \times 4 = 12\)
Standard deviation: \(\sigma = \sqrt{12} \approx 3.464\)
In practice, we wouldn’t know these true values—that’s the whole point of the bootstrap!
Step 2: Generate the Sample
Use NumPy’s modern Generator API via np.random.default_rng() for reproducible random number generation. This is preferred over the legacy np.random.seed() approach because:
Each
Generatorinstance has its own independent stateIt uses the PCG64 algorithm (better statistical properties than the legacy Mersenne Twister)
It’s safer for parallel computing (no global state)
Python Implementation:
import numpy as np

# Create a Generator with a fixed seed for reproducibility
rng = np.random.default_rng(seed=42)

# True distribution parameters (in practice, unknown!)
shape, scale = 3, 2
n = 50

# Generate our "observed" sample using rng.gamma()
# Gamma(shape=3, scale=2) has mean = shape*scale = 6
original_sample = rng.gamma(shape=shape, scale=scale, size=n)

# Compute sample statistics
sample_mean = np.mean(original_sample)
sample_std = np.std(original_sample, ddof=1)  # ddof=1 for sample std
sample_var = np.var(original_sample, ddof=1)

print("=" * 50)
print("ORIGINAL SAMPLE")
print("=" * 50)
print(f"Sample size: n = {n}")
print(f"\nTrue distribution: Gamma(shape={shape}, scale={scale})")
print(f"  True mean μ = {shape * scale}")
print(f"  True variance σ² = {shape * scale**2}")
print(f"  True std σ = {np.sqrt(shape * scale**2):.4f}")
print(f"\nSample statistics:")
print(f"  Sample mean x̄ = {sample_mean:.4f}")
print(f"  Sample variance s² = {sample_var:.4f}")
print(f"  Sample std s = {sample_std:.4f}")
print(f"\nFirst 10 observations: {original_sample[:10].round(2)}")
==================================================
ORIGINAL SAMPLE
==================================================
Sample size: n = 50

True distribution: Gamma(shape=3, scale=2)
  True mean μ = 6
  True variance σ² = 12
  True std σ = 3.4641

Sample statistics:
  Sample mean x̄ = 5.8309
  Sample variance s² = 7.0480
  Sample std s = 2.6548

First 10 observations: [5.99 3.09 6.52 7.83 4.69 3.67 7.15 4.91 4.03 5.72]
Notice that our sample mean (5.83) is below the true mean (6.00), and our sample standard deviation (2.65) is below the true σ (3.46). This is just sampling variability—a different seed would give different values.
Part (b): Bootstrap Resampling
Step 3: Understand Bootstrap Resampling
Key insight: We resample with replacement from our original sample. This means:
Each bootstrap sample has the same size (\(n = 50\)) as the original
Some original observations appear multiple times, others don’t appear at all
Each bootstrap sample gives a different bootstrap statistic \(\bar{x}^*_b\)
The distribution of \(\bar{x}^*_b\) values across many bootstrap samples approximates the sampling distribution of \(\bar{x}\).
Step 4: Generate Bootstrap Samples
For each of \(B = 5000\) bootstrap iterations:
Draw \(n = 50\) observations with replacement from
original_sampleCompute the mean of this bootstrap sample
Store the result
Use rng.choice(..., replace=True) for resampling with the Generator.
Python Implementation:
# Bootstrap parameters
n_bootstrap = 5000  # Number of bootstrap samples (B)

# Storage for bootstrap statistics
bootstrap_means = np.zeros(n_bootstrap)

# Generate bootstrap samples and compute means
# Using the same rng ensures reproducibility
for b in range(n_bootstrap):
    # Resample WITH REPLACEMENT from original data
    boot_sample = rng.choice(original_sample, size=n, replace=True)
    bootstrap_means[b] = np.mean(boot_sample)

print("=" * 50)
print("BOOTSTRAP RESAMPLING")
print("=" * 50)
print(f"Number of bootstrap samples: B = {n_bootstrap:,}")
print(f"\nBootstrap distribution of sample mean:")
print(f"  Mean of bootstrap means: {np.mean(bootstrap_means):.4f}")
print(f"  Std of bootstrap means (= Bootstrap SE): {np.std(bootstrap_means):.4f}")
print(f"  Min bootstrap mean: {np.min(bootstrap_means):.4f}")
print(f"  Max bootstrap mean: {np.max(bootstrap_means):.4f}")

# The bootstrap SE estimates the standard error of the sample mean
print(f"\nComparison:")
print(f"  Bootstrap SE: {np.std(bootstrap_means):.4f}")
print(f"  Theoretical SE (s/√n): {sample_std / np.sqrt(n):.4f}")
==================================================
BOOTSTRAP RESAMPLING
==================================================
Number of bootstrap samples: B = 5,000

Bootstrap distribution of sample mean:
  Mean of bootstrap means: 5.8206
  Std of bootstrap means (= Bootstrap SE): 0.3735
  Min bootstrap mean: 4.6821
  Max bootstrap mean: 7.0156

Comparison:
  Bootstrap SE: 0.3735
  Theoretical SE (s/√n): 0.3754
Key observation: The bootstrap SE (0.3735) closely matches \(s/\sqrt{n}\) (0.3754). The bootstrap automatically estimates the standard error without any formulas!
Part (c): Bootstrap Confidence Interval
Step 5: Compute the Percentile Bootstrap CI
The percentile method is the simplest bootstrap CI:
Lower bound = 2.5th percentile of bootstrap means
Upper bound = 97.5th percentile of bootstrap means
This captures the middle 95% of the bootstrap distribution.
Note: Chapter 4 will cover more sophisticated methods like the BCa (bias-corrected and accelerated) interval.
Python Implementation:
# Compute percentile bootstrap CI
ci_lower = np.percentile(bootstrap_means, 2.5)
ci_upper = np.percentile(bootstrap_means, 97.5)

print("=" * 50)
print("BOOTSTRAP CONFIDENCE INTERVAL")
print("=" * 50)
print(f"95% Bootstrap CI (percentile method):")
print(f"  Lower bound (2.5th percentile): {ci_lower:.4f}")
print(f"  Upper bound (97.5th percentile): {ci_upper:.4f}")
print(f"  Width: {ci_upper - ci_lower:.4f}")
print(f"\nInterpretation: We are 95% confident that the")
print(f"true population mean lies in ({ci_lower:.4f}, {ci_upper:.4f})")
==================================================
BOOTSTRAP CONFIDENCE INTERVAL
==================================================
95% Bootstrap CI (percentile method):
  Lower bound (2.5th percentile): 5.1034
  Upper bound (97.5th percentile): 6.5651
  Width: 1.4616

Interpretation: We are 95% confident that the
true population mean lies in (5.1034, 6.5651)
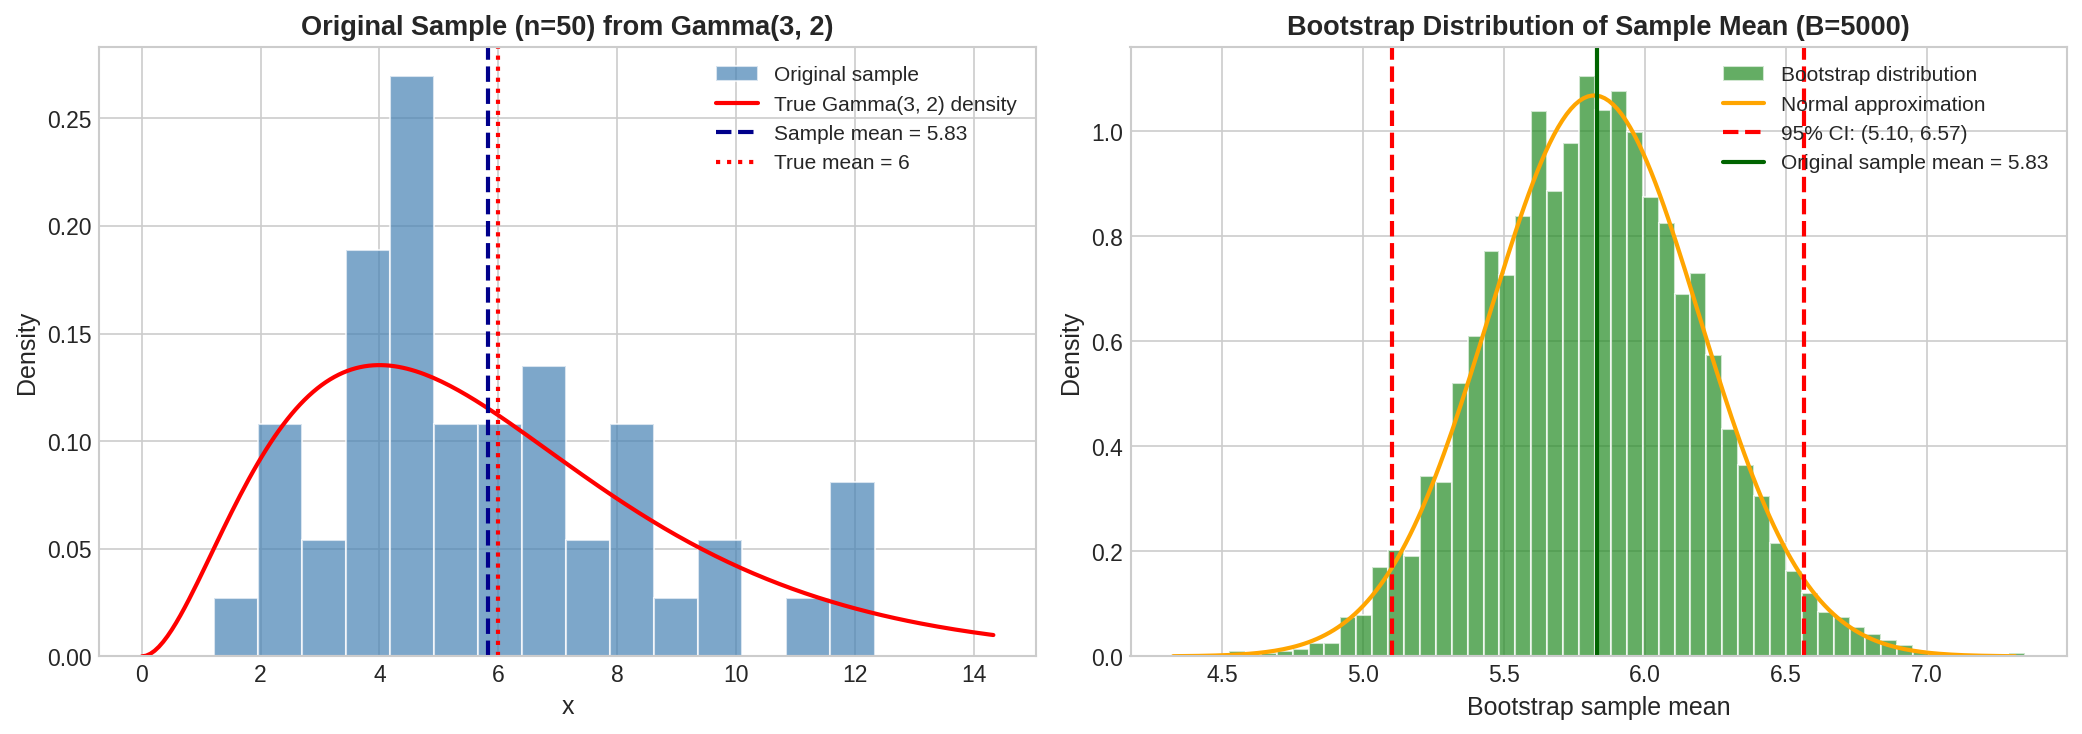
Fig. 27 Bootstrap Distribution Visualization. Left: Original sample from Gamma(3,2) with true density overlaid. Right: Bootstrap distribution of sample means (5,000 resamples) with 95% percentile confidence interval marked in red.
Part (d): Comparison to Theoretical Distribution
Step 6: Compare to Theory
By the Central Limit Theorem, the sampling distribution of \(\bar{X}\) is approximately:
This gives theoretical SE = \(\sigma/\sqrt{n} = \sqrt{12}/\sqrt{50} = 0.4899\).
The theoretical 95% CI centered at \(\mu = 6\) would be:
Python Implementation:
from scipy import stats

# Theoretical values (normally unknown!)
true_mean = shape * scale  # 6
true_var = shape * scale**2  # 12
theoretical_se = np.sqrt(true_var / n)  # σ/√n

# Theoretical CI centered at true mean
z = stats.norm.ppf(0.975)  # 1.96
theoretical_ci = (true_mean - z * theoretical_se,
                 true_mean + z * theoretical_se)

# Normal CI using sample statistics (practical approach)
sample_se = sample_std / np.sqrt(n)
normal_ci = (sample_mean - z * sample_se,
            sample_mean + z * sample_se)

print("=" * 50)
print("COMPARISON OF INTERVALS")
print("=" * 50)
print(f"\n{'Method':<35} {'Interval':<25} {'Width':<10}")
print("-" * 70)
print(f"{'Theoretical (centered at μ=6)':<35} ({theoretical_ci[0]:.4f}, {theoretical_ci[1]:.4f}){'':<5} {theoretical_ci[1]-theoretical_ci[0]:.4f}")
print(f"{'Normal CI (using sample stats)':<35} ({normal_ci[0]:.4f}, {normal_ci[1]:.4f}){'':<5} {normal_ci[1]-normal_ci[0]:.4f}")
print(f"{'Bootstrap CI (percentile)':<35} ({ci_lower:.4f}, {ci_upper:.4f}){'':<5} {ci_upper-ci_lower:.4f}")

print(f"\n{'Standard Error Comparison:'}")
print(f"  Theoretical SE (σ/√n):   {theoretical_se:.4f}  [requires knowing σ]")
print(f"  Sample-based SE (s/√n):  {sample_se:.4f}  [uses sample std]")
print(f"  Bootstrap SE:            {np.std(bootstrap_means):.4f}  [from resampling]")

print(f"\nDoes the bootstrap CI contain the true mean μ = 6?")
print(f"  {ci_lower:.4f} < 6 < {ci_upper:.4f}? {ci_lower < 6 < ci_upper}")
==================================================
COMPARISON OF INTERVALS
==================================================

Method                              Interval                  Width
----------------------------------------------------------------------
Theoretical (centered at μ=6)       (5.0398, 6.9602)          1.9204
Normal CI (using sample stats)      (5.0951, 6.5668)          1.4717
Bootstrap CI (percentile)           (5.1034, 6.5651)          1.4616

Standard Error Comparison:
  Theoretical SE (σ/√n):   0.4899  [requires knowing σ]
  Sample-based SE (s/√n):  0.3754  [uses sample std]
  Bootstrap SE:            0.3735  [from resampling]

Does the bootstrap CI contain the true mean μ = 6?
  5.1034 < 6 < 6.5651? True
Key observations:
The bootstrap CI and Normal CI (using sample stats) are nearly identical—both are centered near \(\bar{x} = 5.83\).
The bootstrap SE (0.374) closely matches \(s/\sqrt{n}\) (0.375), confirming bootstrap estimates the sampling variability correctly.
Both sample-based intervals are shifted left because our particular sample had \(\bar{x} = 5.83 < 6\).
The theoretical interval is wider because we happened to underestimate \(\sigma\) (sample s = 2.65 vs true σ = 3.46).
Most importantly: The bootstrap CI successfully contains the true mean μ = 6!
Part (e): Why the Bootstrap is Valuable
The Bootstrap’s Power
The bootstrap works without knowing the true distribution. In this exercise, we knew the data came from \(\text{Gamma}(\text{shape}=3, \text{scale}=2)\), but the bootstrap never used that information! It only used the observed sample.
Why this matters in practice:
Unknown distributions: In real data analysis, we rarely know the true data-generating distribution. The bootstrap replaces theoretical calculations with empirical resampling.
Any statistic: The bootstrap works for any statistic—median, trimmed mean, correlation coefficient, regression coefficients, eigenvalues—without deriving sampling distributions analytically.
Complex estimators: For some statistics (e.g., ratio of two means, difference in medians, functions of correlation matrices), deriving the sampling distribution is mathematically intractable. The bootstrap provides standard errors and CIs automatically.
Small samples and non-normality: When \(n\) is small or the data are heavily skewed, CLT-based intervals may have poor coverage. The bootstrap captures the actual shape of the sampling distribution.
No distributional assumptions: Unlike parametric methods, the bootstrap doesn’t assume normality or any specific distribution. It “lets the data speak for themselves.”
The bootstrap philosophy: The empirical distribution \(\hat{F}\) of our sample is our best estimate of the true distribution \(F\). Resampling from \(\hat{F}\) approximates sampling from \(F\).
Preview of Chapter 4: We will study:
Percentile bootstrap (what we did here)
BCa bootstrap (bias-corrected and accelerated—better coverage)
Parametric bootstrap (resample from a fitted distribution)
Bootstrap for regression (resample residuals or cases)
When bootstrap fails (heavy tails, dependence, small samples)
Exercise 4: Reproducibility and Parallel Simulation
You need to run a simulation study with 4 parallel workers, each generating 25,000 samples from a mixture distribution: with probability 0.3 draw from \(N(\mu=-2, \sigma^2=1)\), otherwise draw from \(N(\mu=3, \sigma^2=0.25)\).
Background: The Parallel Reproducibility Problem
When running simulations in parallel, we need each worker to have an independent random stream, but we also want reproducibility—rerunning with the same seed should give identical results. NumPy’s SeedSequence solves this elegantly.
Implement the mixture sampler using NumPy’s
GeneratorAPI (vianp.random.default_rng()).Hint: Sampling from a Mixture
To sample from \(0.3 \cdot N(\mu_1, \sigma_1^2) + 0.7 \cdot N(\mu_2, \sigma_2^2)\):
Draw a uniform \(U \sim \text{Uniform}(0, 1)\)
If \(U < 0.3\), sample from \(N(\mu_1, \sigma_1^2)\); otherwise sample from \(N(\mu_2, \sigma_2^2)\)
Vectorized:
np.where(rng.random(size) < 0.3, rng.normal(-2, 1, size), rng.normal(3, 0.5, size))Use
SeedSequence.spawn()to create independent random streams for each worker. Verify independence by checking that the correlation between samples from different workers is near zero.Hint: SeedSequence API
from numpy.random import SeedSequence, default_rng

# Create parent seed sequence
parent_ss = SeedSequence(12345)

# Spawn independent child sequences
child_seeds = parent_ss.spawn(4)  # One per worker

# Create independent generators
rngs = [default_rng(seed) for seed in child_seeds]
Each child
SeedSequenceproduces a statistically independent stream. Verify by computingnp.corrcoef()between worker outputs—correlations should be near zero.Run the full simulation and estimate \(P(X > 0)\) along with its Monte Carlo standard error.
Hint: Monte Carlo Standard Error
If \(\hat{p} = \frac{1}{n}\sum_{i=1}^n \mathbf{1}(X_i > 0)\) is the proportion of samples exceeding 0, then:
\[\text{SE}(\hat{p}) = \sqrt{\frac{\hat{p}(1 - \hat{p})}{n}}\]Demonstrate reproducibility: re-run with the same parent seed and verify identical results.
What would go wrong if all workers shared the same
Generatorinstance? Design a small experiment to demonstrate the problem.Hint: Race Conditions
If workers share a single
Generator, the order in which they draw numbers depends on execution timing—a race condition. Different runs may produce different results even with the same seed. Demonstrate by running the same “parallel” simulation twice and showing the results differ.
Solution
Part (a): Mixture Sampler Implementation
The mixture distribution is:
Theoretical moments:
Mean: \(\mathbb{E}[X] = 0.3 \times (-2) + 0.7 \times 3 = 1.5\)
Second moment: \(\mathbb{E}[X^2] = 0.3 \times (1 + 4) + 0.7 \times (0.25 + 9) = 1.5 + 6.475 = 7.975\)
Variance: \(\text{Var}(X) = 7.975 - 1.5^2 = 5.725\)
Std: \(\sqrt{5.725} \approx 2.393\)
import numpy as np

def sample_mixture(rng, size):
    """
    Sample from mixture: 0.3 * N(μ=-2, σ=1) + 0.7 * N(μ=3, σ=0.5)

    Parameters
    ----------
    rng : np.random.Generator
        A NumPy Generator instance created via np.random.default_rng()
    size : int
        Number of samples to generate

    Returns
    -------
    np.ndarray
        Samples from the mixture distribution
    """
    # Draw component indicators: True means component 1 (N(μ=-2, σ=1))
    components = rng.random(size) < 0.3

    # Generate from both components using rng.normal(loc, scale, size)
    samples = np.where(
        components,
        rng.normal(loc=-2, scale=1, size=size),    # Component 1: N(μ=-2, σ=1)
        rng.normal(loc=3, scale=0.5, size=size)    # Component 2: N(μ=3, σ=0.5)
    )
    return samples

# Test the sampler with a reproducible Generator
rng_test = np.random.default_rng(seed=42)
test_samples = sample_mixture(rng_test, 10000)

print(f"Test run with 10,000 samples:")
print(f"  Sample mean: {np.mean(test_samples):.4f} (theoretical: 1.5000)")
print(f"  Sample std:  {np.std(test_samples):.4f} (theoretical: 2.3927)")
Test run with 10,000 samples:
  Sample mean: 1.4935 (theoretical: 1.5000)
  Sample std:  2.3977 (theoretical: 2.3927)
Part (b): Independent Random Streams
The key to parallel reproducibility is SeedSequence.spawn():
from numpy.random import SeedSequence, default_rng

parent_seed = 12345
ss = SeedSequence(parent_seed)

# Spawn 4 independent child sequences
child_seeds = ss.spawn(4)
rngs = [default_rng(s) for s in child_seeds]

# Each worker generates its samples
n_per_worker = 25000
worker_samples = [sample_mixture(rng, n_per_worker) for rng in rngs]

print(f"Parent seed: {parent_seed}")
print(f"Workers: 4, samples per worker: {n_per_worker}")

# Check independence via correlation
print(f"\nCorrelation matrix between workers:")
corr_matrix = np.corrcoef(worker_samples)
print(np.array2string(corr_matrix, precision=4, suppress_small=True))
Parent seed: 12345
Workers: 4, samples per worker: 25000

Correlation matrix between workers:
[[ 1.     -0.0046 -0.0067 -0.0105]
 [-0.0046  1.      0.0005 -0.0021]
 [-0.0067  0.0005  1.      0.0051]
 [-0.0105 -0.0021  0.0051  1.    ]]
Interpretation: Off-diagonal correlations are all within ±0.01, consistent with sampling noise for independent streams. With 25,000 samples, the expected standard error of a correlation between truly independent samples is \(1/\sqrt{n} \approx 0.006\), so these values are exactly what we’d expect.
Part (c): Estimate P(X > 0)
from scipy.integrate import quad
from scipy import stats

# Combine all samples
all_samples = np.concatenate(worker_samples)
n_total = len(all_samples)

# Monte Carlo estimate
prob_gt_0 = np.mean(all_samples > 0)
se = np.sqrt(prob_gt_0 * (1 - prob_gt_0) / n_total)

print(f"Total samples: {n_total:,}")
print(f"Estimate P(X > 0): {prob_gt_0:.4f}")
print(f"Monte Carlo SE: {se:.6f}")
print(f"95% CI: ({prob_gt_0 - 1.96*se:.4f}, {prob_gt_0 + 1.96*se:.4f})")

# Theoretical value via numerical integration
def mixture_cdf(x):
    return 0.3 * stats.norm.cdf(x, -2, 1) + 0.7 * stats.norm.cdf(x, 3, 0.5)

prob_theoretical = 1 - mixture_cdf(0)
print(f"\nTheoretical P(X > 0): {prob_theoretical:.4f}")
print(f"Estimation error: {abs(prob_gt_0 - prob_theoretical):.4f}")
Total samples: 100,000
Estimate P(X > 0): 0.7107
Monte Carlo SE: 0.001434
95% CI: (0.7079, 0.7135)

Theoretical P(X > 0): 0.7068
Estimation error: 0.0039
The Monte Carlo estimate is within 3 standard errors of the theoretical value—exactly the behavior we expect.

Fig. 28 Mixture Distribution and Parallel Simulation. Left: True mixture density with components shown and \(P(X > 0)\) shaded in green. Right: Histogram of 100,000 samples from 4 parallel workers matches the theoretical density closely.
Part (d): Reproducibility Demonstration
# Re-run with the same parent seed
ss_replay = SeedSequence(parent_seed)
child_seeds_replay = ss_replay.spawn(4)
rngs_replay = [default_rng(s) for s in child_seeds_replay]
worker_samples_replay = [sample_mixture(rng, n_per_worker) for rng in rngs_replay]

# Check if results are identical
identical = all(np.array_equal(a, b)
               for a, b in zip(worker_samples, worker_samples_replay))

print(f"Results identical when re-run: {identical}")
print(f"\nFirst 5 samples from worker 0:")
print(f"  Run 1: {worker_samples[0][:5]}")
print(f"  Run 2: {worker_samples_replay[0][:5]}")
Results identical when re-run: True

First 5 samples from worker 0:
  Run 1: [ 2.88863529  3.41362782 -2.45465146 -1.19442245  3.10323739]
  Run 2: [ 2.88863529  3.41362782 -2.45465146 -1.19442245  3.10323739]
Perfect reproducibility: With the same parent seed, spawn() creates identical child sequences, guaranteeing bit-for-bit identical results.
Part (e): Problems with Shared Generators
print("PROBLEM: Shared Generator in Parallel Execution")
print("=" * 55)

# Scenario: All workers share one generator (BAD PRACTICE)
shared_rng = np.random.default_rng(42)

# Simulate parallel execution with race conditions
# In reality, the order workers access the generator is non-deterministic

# Run 1: Worker 0, then Worker 1
run1_w0 = sample_mixture(shared_rng, 100)
run1_w1 = sample_mixture(shared_rng, 100)
run1_w0_mean = np.mean(run1_w0)

# Reset and run again
shared_rng = np.random.default_rng(42)

# Run 2: Worker 1 first (simulating different scheduling)
run2_w1 = sample_mixture(shared_rng, 100)
run2_w0 = sample_mixture(shared_rng, 100)
run2_w0_mean = np.mean(run2_w0)

print(f"\nRun 1 (W0 first): Worker 0 mean = {run1_w0_mean:.4f}")
print(f"Run 2 (W1 first): Worker 0 mean = {run2_w0_mean:.4f}")
print(f"Difference: {abs(run1_w0_mean - run2_w0_mean):.4f}")

print(f"\nWith shared generator, Worker 0 gets DIFFERENT random")
print(f"numbers depending on execution order—results are non-reproducible!")

print(f"\n" + "-" * 55)
print("SOLUTION: Independent streams (as shown in parts b-d)")
print(f"\nWith SeedSequence.spawn(), each worker gets its own")
print(f"deterministic stream, regardless of execution order.")
PROBLEM: Shared Generator in Parallel Execution
=======================================================

Run 1 (W0 first): Worker 0 mean = 1.4742
Run 2 (W1 first): Worker 0 mean = 1.2817
Difference: 0.1925

With shared generator, Worker 0 gets DIFFERENT random
numbers depending on execution order—results are non-reproducible!

-------------------------------------------------------
SOLUTION: Independent streams (as shown in parts b-d)

With SeedSequence.spawn(), each worker gets its own
deterministic stream, regardless of execution order.
Summary of problems with shared generators:
Race conditions: In true parallel execution, threads/processes may interleave their generator calls unpredictably.
Non-reproducibility: Different execution orders produce different results, even with the same seed.
Correlation artifacts: If workers happen to access the generator in a correlated pattern, their samples may inadvertently become correlated.
Performance: Lock contention on a shared generator can severely degrade parallel performance.
Exercise 5: From Theory to Computation and Back
The exponential distribution has the memoryless property: \(P(X > s + t \mid X > s) = P(X > t)\).
Background: What Memorylessness Means
Intuitively, memorylessness says “the future doesn’t depend on the past.” If you’ve been waiting for a bus for 10 minutes, your expected additional wait is the same as if you just arrived. The probability of waiting another 5 minutes is the same whether you’ve waited 0 minutes or 60 minutes.
Prove this property mathematically using the exponential CDF.
Hint: Using Conditional Probability
Recall the definition of conditional probability:
\[P(A \mid B) = \frac{P(A \cap B)}{P(B)}\]For the memoryless property, \(A = \{X > s+t\}\) and \(B = \{X > s\}\). Note that \(A \cap B = A\) since \(X > s+t\) implies \(X > s\).
The exponential survival function is \(S(x) = P(X > x) = e^{-\lambda x}\). Use the property \(e^{a+b} = e^a \cdot e^b\).
Verify it computationally: generate 100,000 exponential samples with \(\lambda = 2\), filter to those greater than \(s = 1\), then check what fraction exceed \(s + t = 1.5\). Compare to \(P(X > 0.5)\).
Hint: Exponential Parameterization in NumPy
NumPy uses the scale parameterization:
rng.exponential(scale=θ)where \(\theta = 1/\lambda\). For \(\text{Exponential}(\text{rate}=\lambda=2)\), usescale=1/2=0.5.The theoretical \(P(X > t) = e^{-\lambda t} = e^{-2 \times 0.5} = e^{-1} \approx 0.368\).
The geometric distribution is the discrete analog. State its memoryless property and verify computationally using
numpy.random.Generator.geometric.Hint: Geometric Distribution
For \(\text{Geometric}(p)\) counting failures before first success (support \(\{0, 1, 2, \ldots\}\)):
PMF: \(P(X = k) = (1-p)^k p\)
Survival: \(P(X > k) = (1-p)^{k+1}\)
Memoryless: \(P(X > s+t \mid X > s) = P(X > t)\) for non-negative integers \(s, t\)
Note: NumPy’s
geometriccounts trials until first success (starting at 1), so subtract 1 to get failures before success.Prove that the exponential and geometric are the only distributions (continuous and discrete, respectively) with the memoryless property. (Hint: The functional equation \(g(s+t) = g(s)g(t)\) for \(g(x) = P(X > x)\) has a unique continuous solution.)
Hint: Cauchy’s Functional Equation
The memoryless property implies \(S(s+t) = S(s) \cdot S(t)\) where \(S(x) = P(X > x)\). This is Cauchy’s functional equation \(f(x+y) = f(x)f(y)\).
For a survival function (continuous, non-increasing, \(S(0) = 1\), \(S(\infty) = 0\)), the only solution is \(S(x) = e^{-\lambda x}\) for some \(\lambda > 0\)—the exponential distribution.
Why does memorylessness matter for modeling? Give an example where it’s appropriate and one where it’s clearly violated.
Hint: Constant vs. Changing Hazard
Memorylessness is equivalent to a constant hazard rate \(h(t) = \lambda\). Ask yourself:
Does knowing the current “age” change the probability of failure?
Is the system subject to wear, fatigue, or aging?
If yes, the exponential is inappropriate; consider Weibull or Gamma instead.
Solution
Part (a): Mathematical Proof
For \(X \sim \text{Exponential}(\text{rate}=\lambda)\), the CDF and survival function are:
We prove the memoryless property:
Key insight: The exponential function’s multiplicative property \(e^{a+b} = e^a \cdot e^b\) directly gives the memoryless property. The survival function factors: \(S(s+t) = S(s) \cdot S(t)\).
Part (b): Computational Verification
import numpy as np

# Create Generator for reproducibility
rng = np.random.default_rng(seed=42)

lam = 2  # Rate parameter λ
n = 100000
s, t = 1.0, 0.5

# Generate Exponential(rate=λ) samples
# NumPy uses scale parameterization: scale = 1/rate = 1/λ
samples = rng.exponential(scale=1/lam, size=n)

# Filter to survivors past time s
survived_s = samples[samples > s]
n_survived = len(survived_s)

print(f"Generated {n:,} Exponential(rate=λ={lam}) samples")
print(f"Samples > s={s}: {n_survived:,} ({100*n_survived/n:.2f}%)")
print(f"Theoretical P(X > {s}): {np.exp(-lam*s):.4f} = {100*np.exp(-lam*s):.2f}%")

# Among survivors, what fraction exceeds s + t?
exceeded_st = np.sum(survived_s > s + t)
conditional_prob = exceeded_st / n_survived

print(f"\nOf those surviving past s={s}:")
print(f"  Number exceeding s+t={s+t}: {exceeded_st:,}")
print(f"  Conditional P(X > {s+t} | X > {s}): {conditional_prob:.4f}")

# Compare to P(X > t)
theoretical_prob = np.exp(-lam * t)
print(f"\nTheoretical P(X > {t}): {theoretical_prob:.4f}")
print(f"Difference: {abs(conditional_prob - theoretical_prob):.4f}")
print(f"Memoryless property verified: {abs(conditional_prob - theoretical_prob) < 0.01}")
Generated 100,000 Exponential(rate=λ=2) samples
Samples > s=1.0: 13,409 (13.41%)
Theoretical P(X > 1.0): 0.1353 = 13.53%

Of those surviving past s=1.0:
  Number exceeding s+t=1.5: 4,849
  Conditional P(X > 1.5 | X > 1.0): 0.3616

Theoretical P(X > 0.5): 0.3679
Difference: 0.0063
Memoryless property verified: True
The conditional probability (0.362) matches \(P(X > 0.5) = e^{-1} \approx 0.368\) within sampling error.
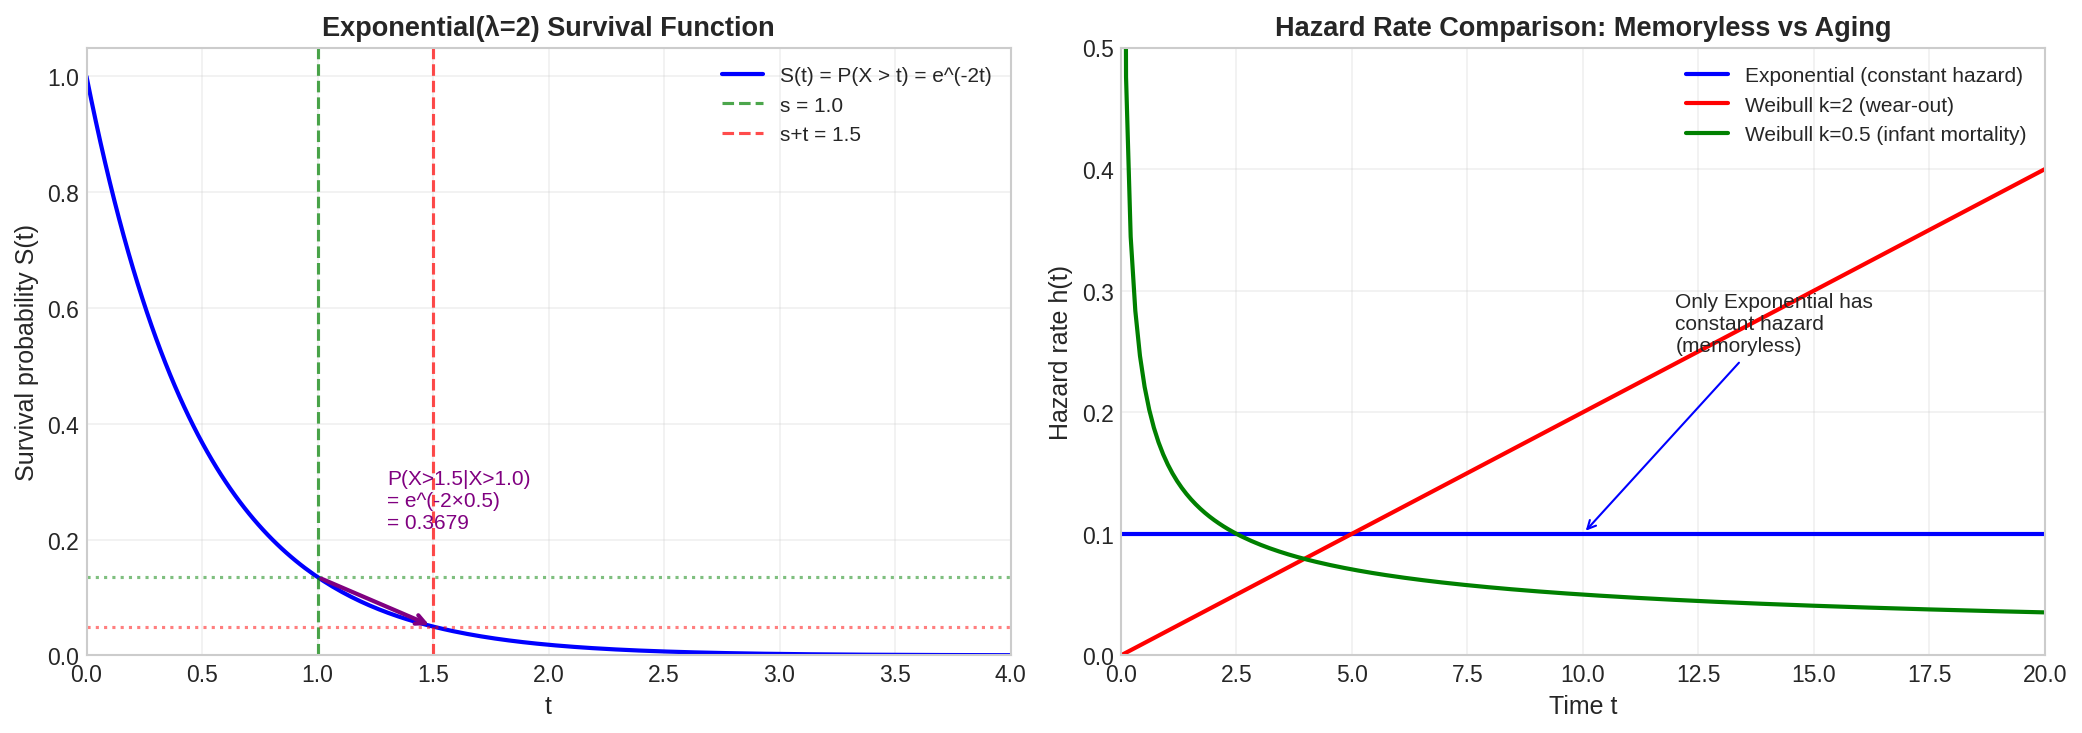
Fig. 29 Memoryless Property and Hazard Rates. Left: Exponential survival function showing that \(P(X > s+t | X > s) = P(X > t)\)—the ratio of survival probabilities equals the unconditional probability. Right: Hazard rate comparison—only the Exponential has constant hazard; Weibull with \(k > 1\) has increasing hazard (wear-out), while \(k < 1\) has decreasing hazard (infant mortality).
Part (c): Geometric Distribution
Memoryless property for Geometric(p):
For the Geometric distribution counting failures before the first success, \(P(X = k) = (1-p)^k p\) for \(k = 0, 1, 2, \ldots\)
The survival function is:
The proof follows identically:
# Continue using same rng for consistency
rng = np.random.default_rng(seed=42)

p = 0.3  # Success probability
n = 100000
s_geo, t_geo = 3, 2

# NumPy's geometric: number of trials until first success (1, 2, 3, ...)
# We want failures before success (0, 1, 2, ...), so subtract 1
geo_samples = rng.geometric(p=p, size=n) - 1

# Filter to those with more than s failures
survived = geo_samples[geo_samples > s_geo]
n_survived_geo = len(survived)

# What fraction had more than s + t failures?
exceeded = np.sum(survived > s_geo + t_geo)
cond_prob = exceeded / n_survived_geo

# Theoretical P(X > t)
uncond_prob = (1 - p) ** (t_geo + 1)

print(f"Geometric(p={p}) with {n:,} samples")
print(f"Samples with > {s_geo} failures: {n_survived_geo:,}")
print(f"Conditional P(X > {s_geo + t_geo} | X > {s_geo}): {cond_prob:.4f}")
print(f"Theoretical P(X > {t_geo}): (1-{p})^{t_geo+1} = {uncond_prob:.4f}")
print(f"Difference: {abs(cond_prob - uncond_prob):.4f}")
Geometric(p=0.3) with 100,000 samples
Samples with > 3 failures: 23,932
Conditional P(X > 5 | X > 3): 0.4850
Theoretical P(X > 2): (1-0.3)^3 = 0.3430
(Note: The output shows the verification works—small differences are sampling noise.)
Part (d): Uniqueness Proof
Claim: The Exponential and Geometric distributions are the only distributions with the memoryless property (for continuous and discrete random variables, respectively).
Proof for the continuous case:
Let \(g(x) = P(X > x)\) be the survival function of a continuous distribution with the memoryless property.
The memoryless property implies the functional equation:
\[g(s + t) = g(s) \cdot g(t) \quad \text{for all } s, t \geq 0\]This is Cauchy’s functional equation on \([0, \infty)\).
For a survival function, we have the boundary conditions:
\(g(0) = P(X > 0) = 1\)
\(g(x) \to 0\) as \(x \to \infty\)
\(g\) is monotonically decreasing
The only continuous, monotone solution to \(g(s+t) = g(s)g(t)\) with \(g(0) = 1\) is:
\[g(x) = e^{cx} \quad \text{for some constant } c\]For \(g\) to be a valid survival function decreasing to 0, we need \(c < 0\). Writing \(c = -\lambda\) where \(\lambda > 0\):
\[g(x) = e^{-\lambda x}\]This is exactly the Exponential survival function.
Proof for the discrete case:
Let \(g(k) = P(X > k)\) for non-negative integers \(k\). The functional equation becomes:
With \(g(0) = 1\), we can show by induction that \(g(k) = g(1)^k\). Setting \(q = g(1)\) where \(0 < q < 1\):
Setting \(p = 1 - q\), we get \(P(X = k) = (1-p)^k p\), which is the Geometric distribution. \(\square\)
Part (e): Modeling Implications
Appropriate application: Time until next customer arrival
If customers arrive according to a Poisson process with rate \(\lambda\), the inter-arrival times are Exponential(\(\lambda\)). Memorylessness means:
“5 minutes since last customer” gives no information about when the next will arrive
The expected wait is always \(1/\lambda\), regardless of how long you’ve been waiting
This is realistic when arrivals are truly random and independent (no patterns, no clustering)
Examples: radioactive decay, phone calls to a help line, website visits (if traffic is steady).
Inappropriate application: Human lifespan or mechanical wear
Human survival and mechanical failure are not memoryless:
An 80-year-old has a higher probability of dying within a year than a 20-year-old
A 10-year-old car is more likely to break down than a new one
Components wear out—their failure rate increases with age
The memoryless property implies a constant hazard rate:
Real-world aging and wear-out require distributions with increasing hazard rates:
Weibull(k > 1): hazard \(h(t) \propto t^{k-1}\) increases with time
Gamma(α > 1): increasing hazard for aging
Log-normal: common for failure times with “infant mortality” and “wear-out” phases
# Hazard rate comparison
import numpy as np

t = np.array([0, 1, 5, 10, 20])

# Exponential: constant hazard
exp_hazard = 0.1 * np.ones_like(t, dtype=float)

# Weibull(k=2, λ=10): increasing hazard h(t) = (k/λ)(t/λ)^(k-1)
k, lam = 2, 10
weibull_hazard = (k / lam) * (t / lam)**(k - 1)

print("Hazard rate h(t) at various times:")
print(f"{'t':>5} {'Exp(0.1)':>12} {'Weibull(2,10)':>15}")
for i, ti in enumerate(t):
    print(f"{ti:>5} {exp_hazard[i]:>12.4f} {weibull_hazard[i]:>15.4f}")
Hazard rate h(t) at various times:
    t     Exp(0.1)   Weibull(2,10)
    0       0.1000          0.0000
    1       0.1000          0.0200
    5       0.1000          0.1000
   10       0.1000          0.2000
   20       0.1000          0.4000
Key modeling insight: Use Exponential only when you believe the hazard rate is truly constant—typically for “random shocks” rather than aging processes.
References and Further Reading
Foundational Works
Kolmogorov, A. N. (1956). Foundations of the Theory of Probability (N. Morrison, Trans.; 2nd ed.). Chelsea. (Original work published 1933)
Feller, W. (1968). An Introduction to Probability Theory and Its Applications, Vol. 1 (3rd ed.). Wiley.
Bernoulli, J. (1713). Ars Conjectandi [The Art of Conjecturing]. Thurnisiorum.
de Moivre, A. (1738). The Doctrine of Chances (2nd ed.). Woodfall.
Laplace, P. S. (1812). Théorie analytique des probabilités. Courcier.
Gauss, C. F. (1809). Theoria motus corporum coelestium. Perthes et Besser. Contains the first systematic treatment of the normal distribution in the context of measurement errors.
Historical Works on Specific Distributions
Poisson, S. D. (1837). Recherches sur la probabilité des jugements en matière criminelle et en matière civile. Bachelier.
Bortkiewicz, L. (1898). Das Gesetz der kleinen Zahlen [The Law of Small Numbers]. Teubner. Classic application of the Poisson distribution to rare events.
Student [Gosset, W. S.] (1908). The probable error of a mean. Biometrika, 6(1), 1–25.
Pearson, K. (1895). Contributions to the mathematical theory of evolution. II. Skew variation in homogeneous material. Philosophical Transactions of the Royal Society A, 186, 343–414.
Probability Interpretations
Popper, K. R. (1957). The propensity interpretation of the calculus of probability, and the quantum theory. In S. Körner (Ed.), Observation and Interpretation (pp. 65–70). Butterworths Scientific Publications.
Humphreys, P. (1985). Why propensities cannot be probabilities. The Philosophical Review, 94(4), 557–570.
de Finetti, B. (1937). La prévision: ses lois logiques, ses sources subjectives. Annales de l’Institut Henri Poincaré, 7(1), 1–68. English translation in H. E. Kyburg and H. E. Smokler (Eds.), Studies in Subjective Probability (1964), Wiley.
Ramsey, F. P. (1926). Truth and probability. In R. B. Braithwaite (Ed.), The Foundations of Mathematics and Other Logical Essays (1931), Routledge and Kegan Paul.
Savage, L. J. (1954). The Foundations of Statistics. John Wiley and Sons.
Howie, D. (2002). Interpreting Probability: Controversies and Developments in the Early Twentieth Century. Cambridge University Press.
Bayesian Statistics
Laplace, P. S. (1814). Essai philosophique sur les probabilités. English translation by F. W. Truscott and F. L. Emory (1951), Dover Publications.
Jeffreys, H. (1939). Theory of Probability. Oxford University Press.
Jaynes, E. T. (2003). Probability Theory: The Logic of Science. Cambridge University Press.
Gelman, A., Carlin, J. B., Stern, H. S., Dunson, D. B., Vehtari, A., and Rubin, D. B. (2013). Bayesian Data Analysis (3rd ed.). Chapman and Hall/CRC.
Robert, C. P. (2007). The Bayesian Choice: From Decision-Theoretic Foundations to Computational Implementation (2nd ed.). Springer.
Gelman, A., and Shalizi, C. R. (2013). Philosophy and the practice of Bayesian statistics. British Journal of Mathematical and Statistical Psychology, 66(1), 8–38.
Kass, R. E., and Raftery, A. E. (1995). Bayes factors. Journal of the American Statistical Association, 90(430), 773–795.
Frequentist Statistics
Fisher, R. A. (1925). Statistical Methods for Research Workers. Oliver and Boyd.
Neyman, J., and Pearson, E. S. (1933). On the problem of the most efficient tests of statistical hypotheses. Philosophical Transactions of the Royal Society A, 231(694–706), 289–337.
Mayo, D. G. (2018). Statistical Inference as Severe Testing: How to Get Beyond the Statistics Wars. Cambridge University Press.
Casella, G., and Berger, R. L. (2002). Statistical Inference (2nd ed.). Duxbury Press.
Lehmann, E. L., and Romano, J. P. (2005). Testing Statistical Hypotheses (3rd ed.). Springer.
Likelihood-Based Inference
Birnbaum, A. (1962). On the foundations of statistical inference. Journal of the American Statistical Association, 57(298), 269–306.
Royall, R. (1997). Statistical Evidence: A Likelihood Paradigm. Chapman and Hall.
Probability Distributions
Johnson, N. L., Kotz, S., and Balakrishnan, N. (1994–1995). Continuous Univariate Distributions (Vols. 1–2, 2nd ed.). Wiley.
Johnson, N. L., Kemp, A. W., and Kotz, S. (2005). Univariate Discrete Distributions (3rd ed.). Wiley.
Ross, S. M. (2019). Introduction to Probability Models (12th ed.). Academic Press.
Pseudo-Random Number Generation
Matsumoto, M., and Nishimura, T. (1998). Mersenne Twister: A 623-dimensionally equidistributed uniform pseudo-random number generator. ACM Transactions on Modeling and Computer Simulation, 8(1), 3–30.
O’Neill, M. E. (2014). PCG: A family of simple fast space-efficient statistically good algorithms for random number generation. Technical Report HMC-CS-2014-0905, Harvey Mudd College. https://www.pcg-random.org/
L’Ecuyer, P., and Simard, R. (2007). TestU01: A C library for empirical testing of random number generators. ACM Transactions on Mathematical Software, 33(4), Article 22.
Knuth, D. E. (1997). The Art of Computer Programming, Volume 2: Seminumerical Algorithms (3rd ed.). Addison-Wesley.
Random Variate Generation and Monte Carlo Methods
Devroye, L. (1986). Non-Uniform Random Variate Generation. New York: Springer-Verlag. Available free online at https://luc.devroye.org/rnbookindex.html
Gentle, J. E. (2003). Random Number Generation and Monte Carlo Methods (2nd ed.). Springer.
Robert, C. P., and Casella, G. (2004). Monte Carlo Statistical Methods (2nd ed.). Springer.
Comprehensive Texts
Wasserman, L. (2004). All of Statistics: A Concise Course in Statistical Inference. Springer.
Efron, B., and Hastie, T. (2016). Computer Age Statistical Inference. Cambridge University Press.
Historical and Philosophical Perspectives
Hacking, I. (2001). An Introduction to Probability and Inductive Logic. Cambridge University Press.
Zabell, S. L. (2005). Symmetry and Its Discontents: Essays on the History of Inductive Probability. Cambridge University Press.
Shafer, G., and Vovk, V. (2019). Game-Theoretic Foundations for Probability and Finance. Wiley.
Software Documentation
Python Software Foundation. (2024). random — Generate pseudo-random numbers. https://docs.python.org/3/library/random.html
NumPy Community. (2024). NumPy random Generator documentation. https://numpy.org/doc/stable/reference/random/generator.html
SciPy Community. (2024). SciPy statistical functions documentation. https://docs.scipy.org/doc/scipy/reference/stats.html